
Open interest tells commodity traders how much of a market is still standing: the total number of futures contracts that have been opened and not yet closed, expired or delivered. Read next to price, volume and the contract month, it shows whether a move is being built by fresh positions or worn down by liquidation. On its own, it is context, not a buy or sell signal.
Most retail traders meet open interest as a second number under price on a futures quote, glance at it, and guess. That guess is usually wrong, and the reason is simple: open interest says nothing about direction on its own. It tells you how many contracts are open and how that number changed. Turning that into a trading view means adding price, volume and a healthy suspicion about contract rolls.
This guide covers the 2026 version of the topic that actually matters for anyone trading crude oil, natural gas, gold, silver, copper, wheat, corn or soybeans: what the number counts, how it moves, why it lies more often than people think, and where to look for it. Updated for October 2026.
Key takeaways
- Open interest counts contracts that are still open at the end of the trading day, not trades that happened during it.
- Every futures trade has a buyer and a seller. Open interest rises by one when a position is opened and falls by one when a position is closed.
- Price and open interest together give context: rising OI with rising price usually means new participation, rising OI with falling price usually means new selling.
- Falling open interest describes liquidations, not certainty about direction. The same chart pattern can be a covering rally or a genuine exit.
- Contract rolls make open interest collapse for reasons that have nothing to do with sentiment. Deferred contracts building while the nearby contract drains is normal.
- Exchange open interest is reconciled once a day. Intraday traders are working with a lagging figure and should say so out loud.
- A high open interest level means a contract is well supplied with contracts to trade and well watched by others. It says nothing about bullish or bearish conviction.
Table of Contents
- What Is Open Interest in Commodity Trading?
- What Open Interest Tells Commodity Traders at a Glance
- How to Read Open Interest with Price and Volume
- How to Tell New Positions from Position Liquidations
- What High and Low Open Interest Can—and Cannot—Reveal
- How Traders Use Open Interest for Breakouts and Reversals
- Open Interest for Options Traders
- Open Interest Across Commodity Groups
- Common Open Interest Mistakes
- A Practical Open Interest Checklist
- Frequently Asked Questions
- What does open interest tell?
- Does an increase in open interest mean bullish or bearish?
- What is the difference between volume and open interest?
- What happens if the open interest is high?
- Is open interest a reliable indicator?
- Why does open interest drop when a futures contract rolls?
- Conclusion
What Is Open Interest in Commodity Trading?
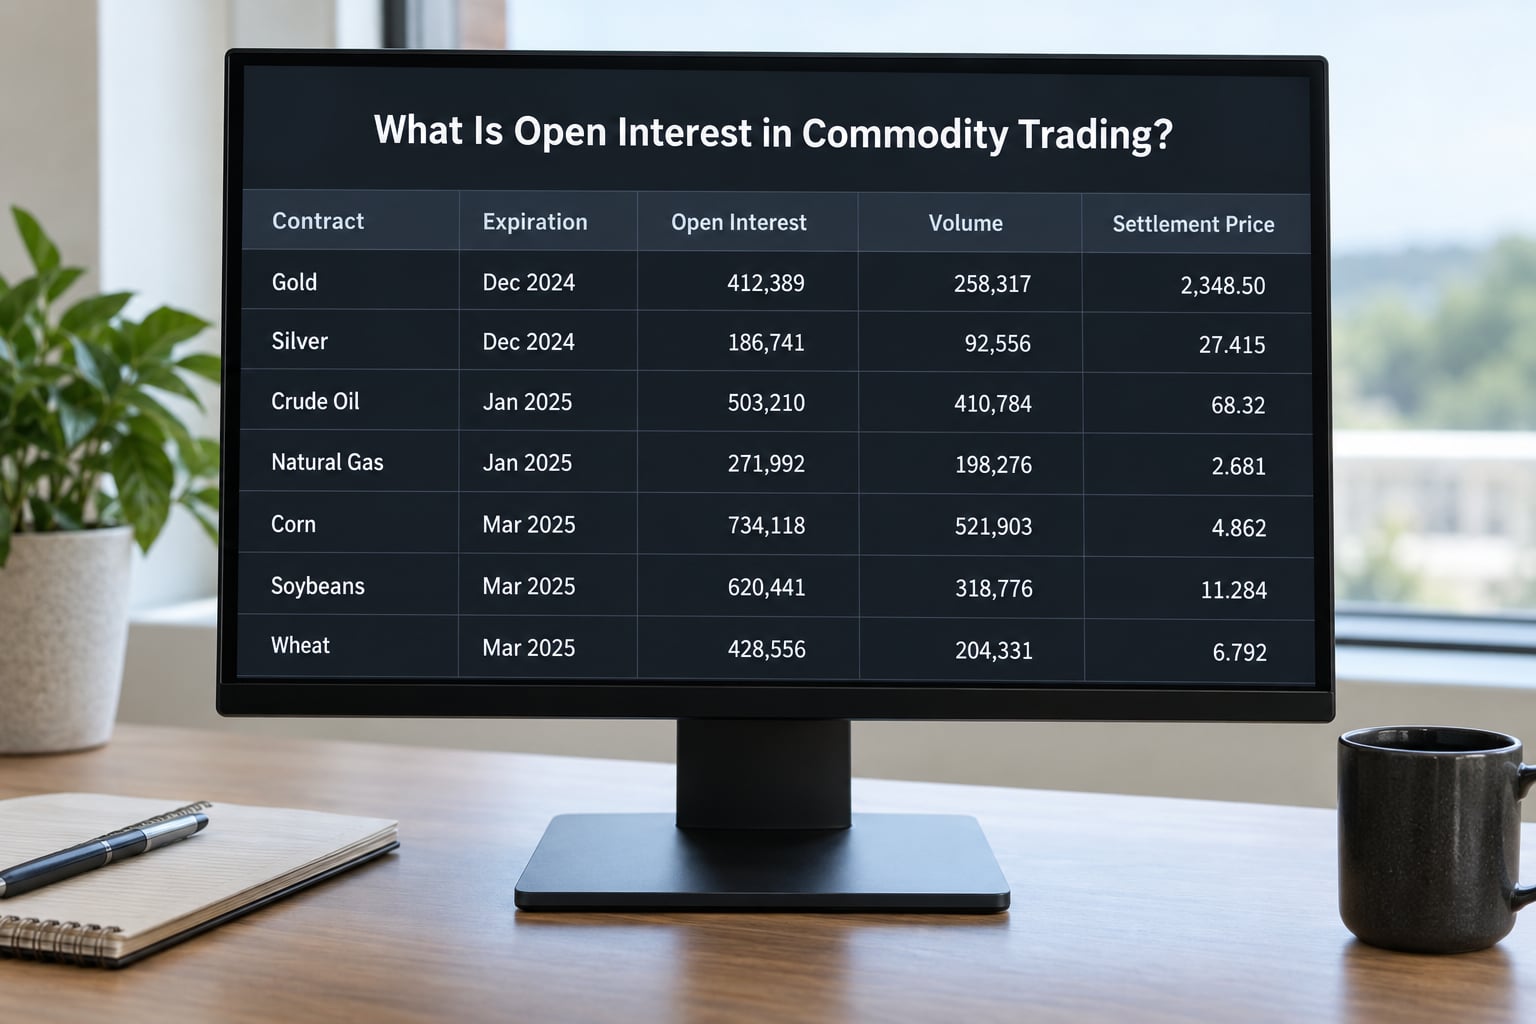
Open interest is the total number of outstanding futures contracts in a market that have not yet been closed, expired, delivered or offset. Every trade pairs a buyer with a seller, so a contract enters the count only when someone opens a position and leaves it only when someone closes one. That gives traders the number of contracts still standing at the close of the session.
Two details trip people up. First, open interest is reported in contracts, not in dollars or commodity quantity, and each commodity contract has its own multiplier. A COMEX gold contract covers 100 troy ounces; a CBOT wheat contract covers 5,000 bushels; a NYMEX natural gas contract covers 10,000 MMBtu. Comparing a raw open interest number across commodities tells you almost nothing, so the useful comparison is contract-to-contract over time.
Second, the exchange publishes the figure after the session ends and reconciles it against its own records. It is not a live number updating with every tick. If you trade intraday, what you see on the screen today describes yesterday’s finished session, and the reporting threshold means only positions above a certain size are captured at all.
Open interest also exists in the options market, where it counts outstanding option contracts rather than outstanding delivery obligations. That distinction matters, and it is covered further down, because options open interest behaves differently from futures open interest and the popular rules for reading it were built for options.
What Open Interest Tells Commodity Traders at a Glance
The most common use of open interest is a four-quadrant read against price direction. The table below is the version worth memorising, and the caveat under it matters more than the table.
| Price | Open interest | What usually happened | What to check next |
|---|---|---|---|
| Rising | Rising | New longs and new shorts both entering; the move has fresh participation behind it | Volume, bid-ask spread, and whether the nearby or the deferred contract is building |
| Rising | Falling | Existing shorts covering into strength; less fuel remains below | Whether open interest rebuilds the next session, which would make the move more than a cover |
| Falling | Rising | New short positions building into the decline | Whether the drop extends on volume or stalls against the prior range |
| Falling | Falling | Longs liquidating; participants leaving rather than reversing | Whether price holds the level once the forced sellers are done |
| Flat | Rising | Positions accumulating without price resolving; a coil building ahead of a move | The range boundaries and where open interest is concentrated by contract month |
| Flat | Falling | Positions unwinding into a quieter market; participation is leaving | Liquidity and spread in the front contract before you size anything |
Each of those combinations offers context rather than proof of who is winning. The same rising price with falling open interest can be shorts covering, a producer selling inventory into strength, or simply a thin session where a few contracts closed by accident. Open interest tells you how many contracts changed hands in position terms, never which side of them you were watching.
How to Read Open Interest with Price and Volume
Volume and open interest measure different things and are often confused. Volume counts the contracts that changed hands during a session and resets to zero every day. Open interest counts what remains standing after the session ends. A contract can trade ten times and end the day with fewer contracts open than it started with.
| Measure | What it counts | When it resets | Best used for |
|---|---|---|---|
| Trading volume | Contracts bought and sold during the session | At the close of every trading day | Gauging activity and checking whether a move had real participation behind it |
| Open interest | Contracts still open at the end of the session | Never resets; it accumulates until positions close or expire | Gauging how committed the market is and how crowded or liquid a contract is |
| Delta volume | Volume classified as new longs versus closing short positions | At the close of every trading day | Refining the read, with the caveat that estimated aggressor direction is an estimate |
| Commitments of Traders | Regulator-reported positions split by trader category | Weekly, from Tuesday positions released on Friday | Seeing who is holding, over a horizon of days and weeks rather than minutes |
Gold is a clean example of reading both together. COMEX gold grinds higher for three sessions, volume expands on the up days, and open interest rises each day. That combination is a trend with fresh money behind it, which is a different setup from gold rising because a handful of shorts covered.
Crude oil shows the other pattern. Front-month WTI rallies sharply on a supply headline, volume spikes, and open interest barely moves. That combination usually means short covering in a contract that was already carrying large positions. The move can be real, but the fuel is finite, and once the covering is done there is no new buying to sustain it.
CBOT wheat makes the point that open interest needs contract context. When the nearby contract approaches its delivery period, open interest in it drops steeply as commercial hedgers and funds close out and move to the deferred contract. Nearby open interest collapsing in late spring says nothing bearish about wheat. Check whether the deferred contract built at the same time before you draw any conclusion.
Volume and open interest can also double-count the same information, which is a mistake experienced traders on trading forums keep pointing out. If price is up, volume is high and open interest is rising, you have roughly one piece of evidence about conviction, not three independent confirmations.
How to Tell New Positions from Position Liquidations
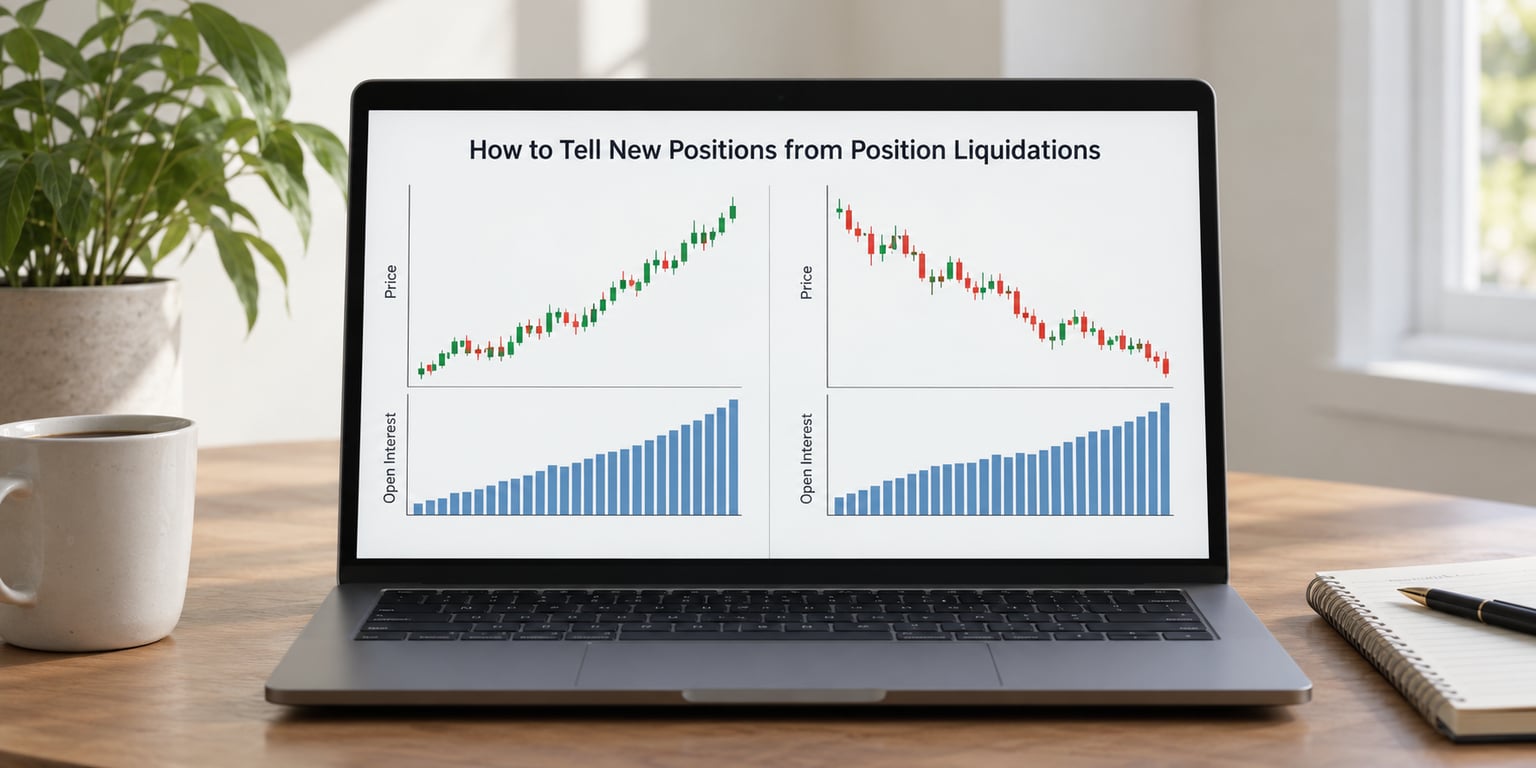
Open interest accounting is mechanical. Here is how a day builds for one contract, with three traders and a starting open interest of 100 contracts.
- Trader A buys 10 contracts from Trader B. A new long and a new short both exist, so open interest rises from 100 to 110.
- Trader C buys 5 contracts from Trader D. Another pair of new positions, so open interest rises to 115.
- Trader A sells 10 contracts to Trader E to close the original long. No new position was created, one contract offset one, so open interest falls to 105.
- Trader F buys 3 contracts to open a new long against Trader G’s new short. Open interest ends the day at 108.
That arithmetic is why the same chart pattern can mean several different things. Falling open interest says positions are being closed. It does not say whether the closing longs were panic sellers or the closing shorts were satisfied sellers, and it never tells you the price level of those exits.
Broker-level data cannot fix this either. Your platform knows your side of a trade and nothing about the counterparty’s, so any chart claiming to show exactly who is opening and who is closing is working from an estimate. Treat directional volume figures as a useful approximation, not a fact.
Three structural effects distort the picture further. Contract rolls move positions from one delivery month to the next, so open interest transfers between contracts rather than leaving the market. Delivery periods do the same at a smaller scale, as positions exit before first notice day. Spread positions, where a trader holds a long in one month and a short in another, register as two open contracts and inflate the count in both months at once.
Veteran posters on futures trading forums make this point constantly: an open interest number in one contract month means very little on its own. The curve, the roll and the delivery calendar have to be in the frame before the number says anything useful.
What High and Low Open Interest Can—and Cannot—Reveal
A contract with a high open interest is one where many positions are outstanding and many participants are watching. That is useful for execution: more open interest generally comes with a tighter bid-ask spread, more visible depth and less slippage on the orders you place. It is also useful for risk: a crowded contract means that when the crowd changes its mind, the exit is thinner than the entry looked.
High open interest is not a bullish signal, and it is not a bearish one. It is a supply statement about contracts. Traders who treat a large number as accumulation, or as a sign that a squeeze is loading up, are reading intent into a count.
Low open interest carries the mirror-image information. Spreads tend to be wider, a position of any size moves the price further, and a stop order can fill much worse than the level you set. Thin open interest in a deferred contract is the normal state before a contract becomes the active one, which is one more reason contract months cannot be compared in isolation.
Open interest can also flag crowding. When a contract’s open interest sits far above its own recent range while price stops moving, positions may be accumulating without a directional outcome. That is a setup to size carefully, not a prediction of which way the break goes. The contrarian camp, including posters on the Trade2Win forums, goes further and treats extreme open interest combined with exhausted price action as a market-bottom tool. That is a defensible framing of the same data and it lands in a different place than trend confirmation, which is a fair description of how messy this indicator is.
How Traders Use Open Interest for Breakouts and Reversals
The practical use of open interest is confirmation, not prediction. A breakout through a prior range with rising volume and rising open interest tells you fresh positions are entering behind the move. The same breakout with falling open interest tells you the move ran on closing positions, which is real but far less durable.
For pullbacks, look at what the open interest does while price pauses. Rising open interest on a shallow pullback in an uptrend suggests buyers are stepping in with new contracts. Falling open interest on the pullback suggests the trend is losing its participants, which is an argument for a tighter stop rather than a reason to add.
Failed moves deserve the same treatment. A break above the range that closes back inside it, with open interest rising during the attempt, means positions were added on a level that did not hold. Those positions now need an exit, and that is a configuration that tends to produce a second, sharper move in the opposite direction. Confirmation rules matter more than the break itself.
Two practical habits make this work. Watch successive observations rather than one session, because a single day’s open interest change can be noise created by one large participant. And state the prior range before the session starts, so your decision rule is written down before you see the number.
Waiting for evidence is the whole discipline. Open interest tells commodity traders how committed the market currently looks, and commitment arriving late is still information worth having.
Open Interest for Options Traders
Options open interest counts outstanding option contracts, which behave differently from futures open interest in ways that trip up beginners moving between the two markets. An option open interest figure tells you how many contracts of that strike and expiry exist. It does not tell you whether the buyers wrote them or the sellers bought them, so the popular shortcut about whether call or put open interest means buyers or sellers cannot be applied directly.
On the futures side, a commodity option sits on top of a futures contract that has its own open interest. The two numbers belong to different instruments and answer different questions. A large call open interest in gold options describes options trading, while gold futures open interest describes the delivery obligation underneath.
Options open interest gets useful when you add context rather than read it alone. Implied volatility tells you what the options are pricing, skew compares calls to puts at the same expiry, and volume at a strike distinguishes active interest from leftover positions carried over from earlier sessions. The centre of mass of open interest across strikes shows where positioning concentrates, which is a topic with a mixed record at best.
The round-number pin risk story familiar from equity options does not transfer cleanly to futures. In futures, expiries cluster differently, contract months roll on their own schedule, and delivery mechanics change who is still around near expiry. The CFTC Commitments of Traders report is the regulatory version of the same question: who holds, split between commercial hedgers, large speculators and small speculators, with Tuesday positions published on Friday afternoon.
Open Interest Across Commodity Groups
Open interest behaves differently in each complex, because the physical markets behind the contracts differ. Reading the same number the same way in metals and natural gas is where a lot of wrong conclusions come from.
| Complex | Typical open interest behaviour | What distorts the number |
|---|---|---|
| Precious metals (gold, silver) | Rises steadily as macro sentiment and ETF-related flows build, often for months at a time | Index and allocation flows moving between contract months |
| Base metals (copper) | Tracks industrial expectations and often expands on growth scares | Smelter and trader hedging against physical supply |
| Energy (crude, natural gas) | Very large totals in the front contract, with heavy activity around storage reports and the roll | Storage-driven roll schedules, producer hedging, delivery risk |
| Agricultural (wheat, corn, soybeans) | Seasonal, following the crop year and export windows rather than calendar months | Contract availability, crop conditions, first notice day |
| Currencies | Built and released constantly as macro data lands | Position limits and bank roll activity |
Energy carries the largest and most public numbers, with NYMEX natural gas and the front-month crude contract often running into six figures of contracts. Storage constraints and roll schedules drive its shape, and the roll happens on a published calendar rather than a market signal.
Grains behave like a seasonal market with a crop cycle behind them. Contract months are limited, so open interest concentrates into fewer deliverables, and the level available for trading changes as contracts expire. Copper and gold sit closer to financial flows, which is why their open interest tends to build and drain with macro narratives rather than with inventories.
Currencies traded on futures exchanges have their own pattern, with heavy roll activity and position limits at the front. In every group, the number that matters is the change relative to that contract’s own history, not the absolute total.
Common Open Interest Mistakes
Open interest is widely misread in the same handful of ways. Each mistake has a practical fix.
Treating it as directional flow. Rising open interest does not mean buyers are winning. It means new positions were created, and the same session created new shorts at the same time. Fix: never read direction from open interest alone, and pair it with price and volume before forming a view.
Reading it as the size of the market. A larger number often reflects contract size, more deliverable months or a limited total supply of contracts, not exceptional conviction. Fix: compare each contract against its own history rather than against another commodity.
Treating high open interest as bullish or as a squeeze warning. A big outstanding position count is neither. Fix: use it to judge liquidity and crowding, then ask what the price is doing separately.
Using it as a substitute for volume. They answer different questions. Volume says how much activity happened today, open interest says how much is still standing. Fix: keep both on the screen and never drop one.
Misreading the roll. The nearby contract drains and the deferred builds as positions move forward. Fix: check whether the deferred contract gained what the nearby lost before reading the collapse as an exit.
Forgetting the daily publication lag. Exchange open interest is reconciled after the session, so an intraday trader is acting on stale context. Fix: note the timestamp and adjust position expectations accordingly.
Treating the COT report as current. COT figures cover Tuesday positions and are published on Friday, so a widely shared extreme positioning number can already be three trading days old. Fix: read it as a slow positioning backdrop, never as a trigger for today’s trade.
Counting the same evidence twice. Price, volume and open interest all move together in a trend. Fix: ask what each number would tell you if the other two were missing.
A Practical Open Interest Checklist
Before you take a position on any commodity contract, work through this sequence. It takes a couple of minutes and it stops most open interest mistakes.
- Confirm you are on the active contract. Check the delivery month on the quote and note when first notice day falls, because the count behaves differently near it.
- Compare against the same contract’s history. Look at open interest today against one month ago and one year ago, not against a different commodity.
- Check the curve. Note which months are building and which are draining. A transfer between months is a roll, not an exit.
- Pair with price direction. Place the change in the four-quadrant table and write down which quadrant you believe it is.
- Check volume. Confirm the session had participation behind the move, and treat volume, price and open interest as one piece of evidence rather than three.
- Look at the spread and depth. A wider bid-ask means size down. Poor exit conditions matter more than a good entry.
- Note the reporting timestamp. Remember the number you are reading describes the previous session, not the current one.
- Add the options and COT context. Check implied volatility and skew if options exist on the contract, and read the weekly Commitments of Traders as a slow backdrop rather than a signal.
Traders value worked numbers over definitions in this topic, and the free data is the part that most guides skip. Current open interest for CME Group contracts including COMEX, CBOT and NYMEX products is published on the CME Group quotes pages, and it is refreshed there after each session. Barchart and TradingView both display open interest alongside volume on commodity contract pages, and both allow you to export the history to a spreadsheet for free. For the regulatory view, the CFTC publishes the Commitments of Traders report weekly. Anyone quoting a current COMEX open interest figure should be pulling it from one of those sources on the day they write.
Frequently Asked Questions
What does open interest tell?
Open interest tells you how many futures contracts are still open at the end of the trading day, and how that number changed. It shows how much of the market is committed and how liquid or crowded a contract is. It does not tell you whether buyers or sellers are winning, and it never predicts direction on its own.
Does an increase in open interest mean bullish or bearish?
By itself, neither. Every new open interest creates a buyer and a seller at the same time. Rising open interest tells you fresh positions are being built. Whether that is bullish depends on what price is doing: price up with open interest up usually means new participation, while price down with open interest up usually means new selling. Read the two together.
What is the difference between volume and open interest?
Volume counts the contracts traded during a single session and resets to zero every day. Open interest counts the contracts still standing after that session ends. A contract can trade heavily and end the day with fewer open contracts than it started with. Volume measures today’s activity; open interest measures accumulated commitment.
What happens if the open interest is high?
A high open interest usually means better liquidity: tighter bid-ask spreads, more visible depth and less slippage, which makes the contract easier to trade. It also means more crowded positioning, so a fast unwind can leave exits thinner than entries suggested. High open interest says nothing about bullish or bearish sentiment by itself.
Is open interest a reliable indicator?
It is reliable as confirmation and unreliable as prediction. Experienced traders on trading forums consistently treat it as a filter on price action rather than an entry trigger. It is also a lagging figure, published once daily after the session is reconciled, and contract rolls distort it. Use it to size and to confirm, not to call direction.
Why does open interest drop when a futures contract rolls?
Positions move from the expiring contract into the next delivery month, so open interest transfers between contracts rather than leaving the market. The nearby contract drains while the deferred builds. If the decline happens near first notice day or delivery, it is a mechanical effect of contract structure, not a signal that traders are bearish. Check the curve before drawing conclusions.
Conclusion
What open interest tells commodity traders is how much of the market is still committed, and how committed it is relative to that contract’s own history. That makes it a positioning and participation clue, not a stand-alone signal.
Start with the active contract, note where its open interest sits against a month ago and a year ago, and read the change next to price and volume before forming any view. Check the curve so a roll is not mistaken for an exit, and check the timestamp so yesterday’s number is not treated as today’s. Get those right and open interest becomes one of the more useful filters in a futures workflow.
This article is educational and general. Market data and contract specifications change, so confirm current figures with the exchange and your broker, and treat nothing here as individual investment advice.