Futures roll yield is the gain or loss a futures-based ETF books each time it sells an expiring contract and buys the next one, and it is driven entirely by the shape of the futures curve. In contango the replacement costs more than the contract being sold, so the swap loses money; in backwardation it costs less, so the swap earns money. That single mechanic can add or subtract several percentage points a year, compounding, quite apart from whatever the commodity price does.
Most of the confusion I see comes from comparing a fund’s market price to a commodity’s spot quote and assuming the gap is a fee. It usually is not. What follows breaks the return into its pieces so you can see exactly where the difference comes from and check it yourself on any fund you own.
This is educational material, not investment advice. Fund structures, expense ratios and curve shapes change over time, so read the current prospectus before you act on anything here.
Table of Contents
- What Is Futures Roll Yield?
- How Futures Roll Yield Affects ETF Returns
- A worked example: what steady contango costs
- Contango vs. Backwardation
- Why Roll Yield Is Not the Same as an ETF’s Price Return
- How to Evaluate Roll Yield in a Futures ETF
- How Market Conditions Affect Futures ETF Results
- Frequently Asked Questions
- Is roll yield guaranteed?
- Why can a commodity ETF fall when the commodity price rises?
- How do I calculate roll yield for a fund?
- Does roll yield affect every ETF?
- What happens when futures roll?
- Is a managed futures or volatility ETF affected the same way?
- Conclusion
What Is Futures Roll Yield?
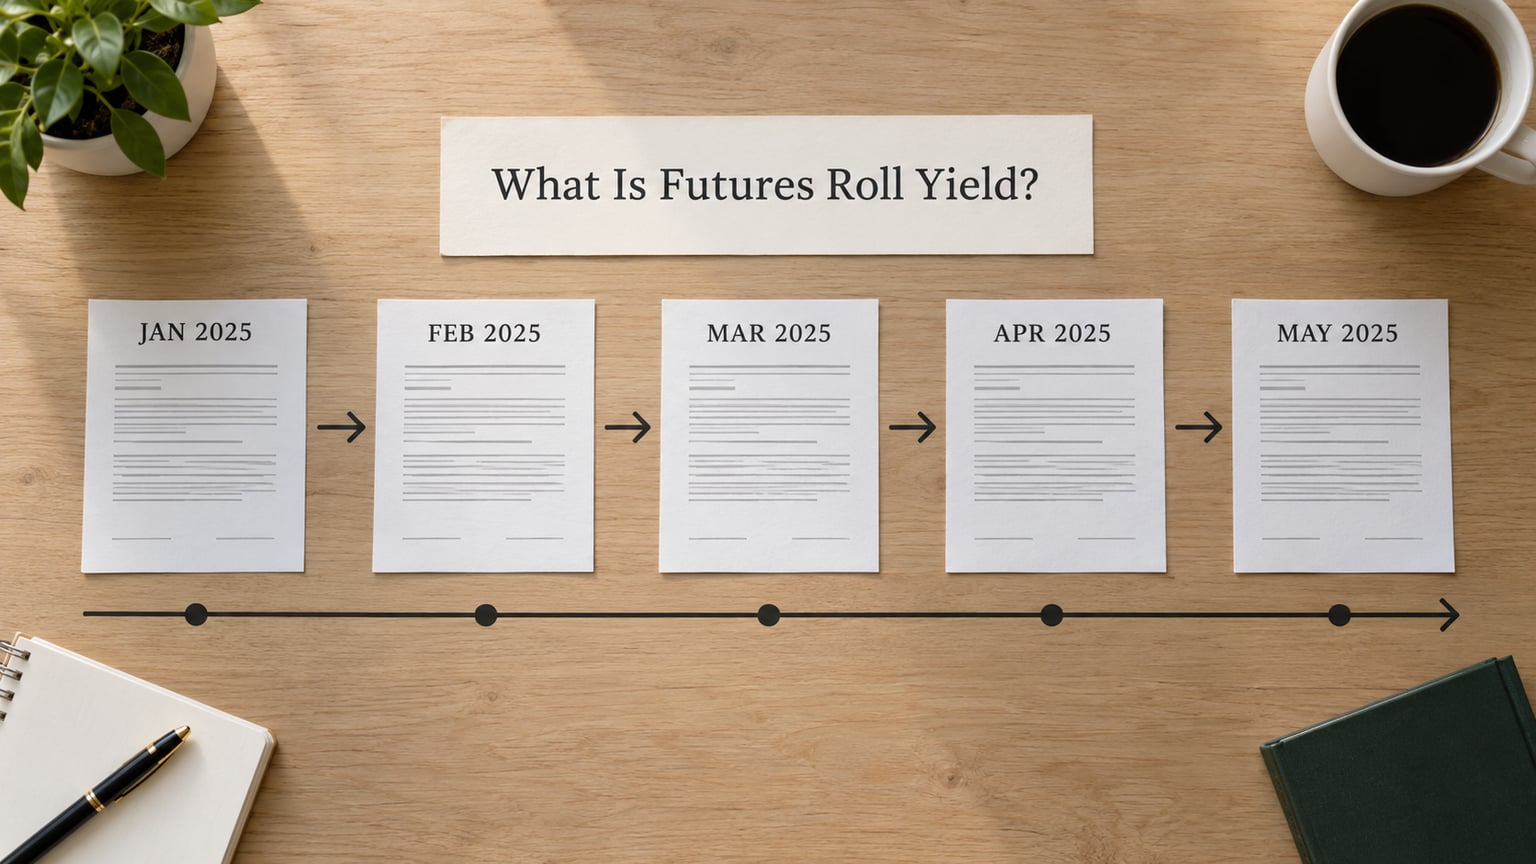
Futures roll yield is the profit or loss a fund generates when it replaces an expiring futures contract with a more distant one, and the result comes from the difference in price between the two contracts rather than from any trading skill or manager decision.
Why does the replacement happen at all? Because a futures contract has an expiry date. A crude oil contract for delivery in September stops being useful in August, so a fund that tracks an oil index cannot simply hold it. It has to sell what is expiring and buy the contract further out the curve. That swap is the roll, and its result is the roll return, usually expressed as an annualized percentage.
Three terms do most of the work in this area, and they are worth having straight before going further:
- Front-month contract — the nearest expiry still trading, the one a naive tracker would buy.
- Futures price curve — the ladder of prices for each later expiry, which is what determines whether a roll helps or hurts.
- Spot price — the price of the physical commodity right now, the number most quoted on the news and the one the fund will never exactly match.
One important framing point: roll yield is a market outcome, not a fund fee. No sponsor is taking a cut of it. The money is made or lost because of where the curve sits and which direction it points.
How Futures Roll Yield Affects ETF Returns
Understanding the four mechanics of a roll makes the whole thing concrete. The process repeats every month for most commodity funds, and in a year you get roughly twelve of these events.
- The contract approaches expiry. The fund still holds the near-dated contract it bought, or its rolling position in it, and it is now close to delivery or settlement.
- The fund sells the expiring contract. This closes out the position at whatever the market is paying that day.
- The fund buys the next contract out. This is the more expensive or less expensive leg, and the price difference is the whole story.
- The result compounds. A drag of a few percent a year is not a one-time haircut; it repeats and it interacts with everything else the fund earns.
A worked example: what steady contango costs
Take a fund whose front-month contract trades at 100.00 and the next month at 100.34. That gap is contango of 0.34% for that month. If the curve holds that shape and the fund rolls monthly, twelve rolls give roughly 4% of annualized drag, before expenses.
On a 10,000-dollar position that is about 400 dollars a year, and it is subtracted from what the commodity itself did. If the spot price rose 8% over the same period and the fund carried a 0.75% expense ratio, the arithmetic looks like this:
| Component | Contribution | What it means |
|---|---|---|
| Price return (spot) | +8.0% | What the commodity itself did |
| Collateral income | +3.5% | Interest earned on cash and short-term bills held against the contracts |
| Roll return | -4.0% | Cost of replacing expiring contracts in contango |
| Fees and expenses | -0.75% | Management fee and fund costs |
| Total return (approximate) | +6.75% | What the holder actually earned |
That table is the single most useful thing to take away. The commodity rose 8% and the fund returned about 6.75%, and the difference is fully explained by two lines you can check. Nobody lost anything mysteriously.
Note that collateral income matters as much as the roll here. Before 2022, short-term bill yields sat near zero, so that line was close to nothing and roll drag was the dominant force working against holders. Since 2022 the collateral line has been worth several percentage points for many funds, which is one reason the industry has started talking about total return rather than just price return.
Contango vs. Backwardation
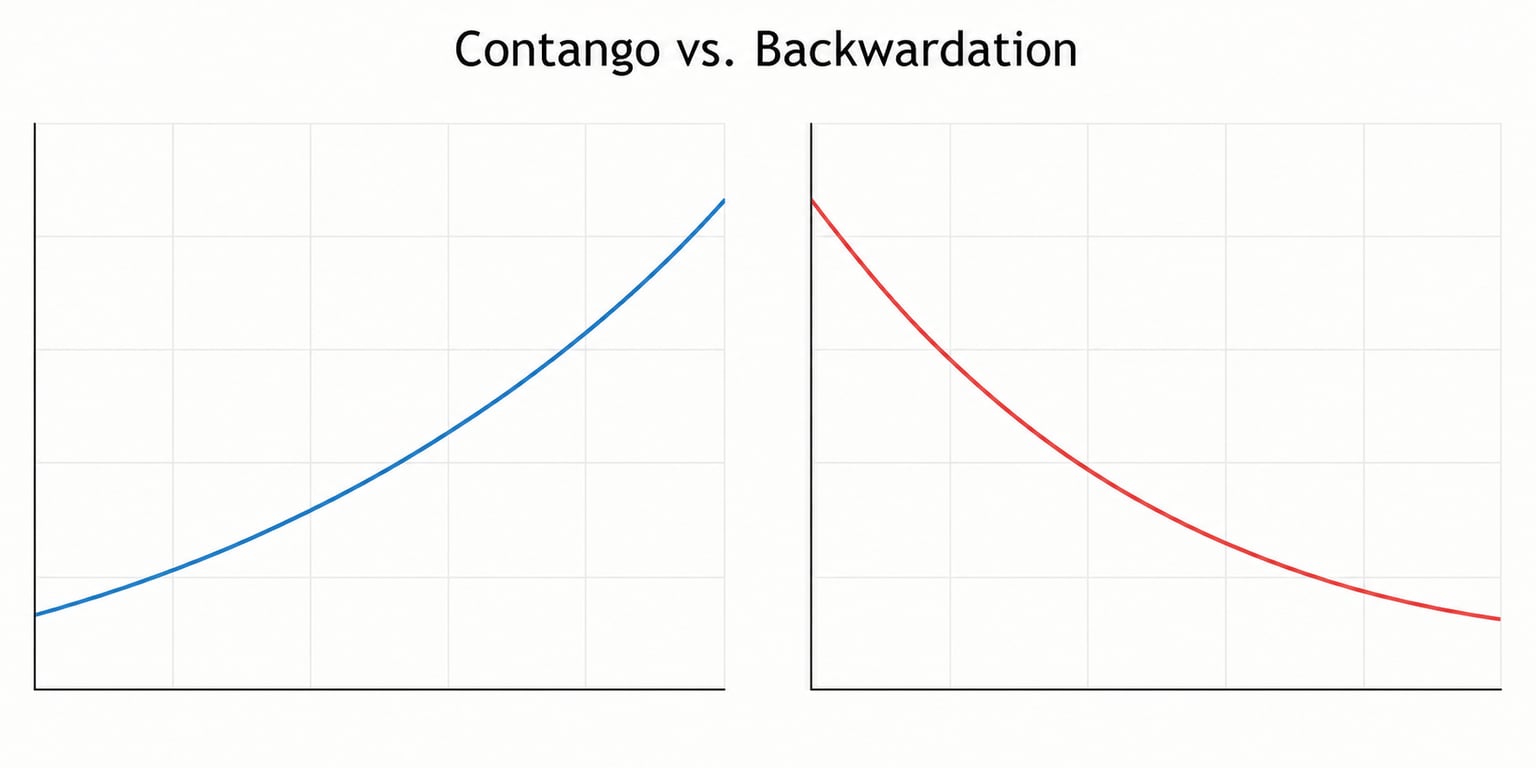
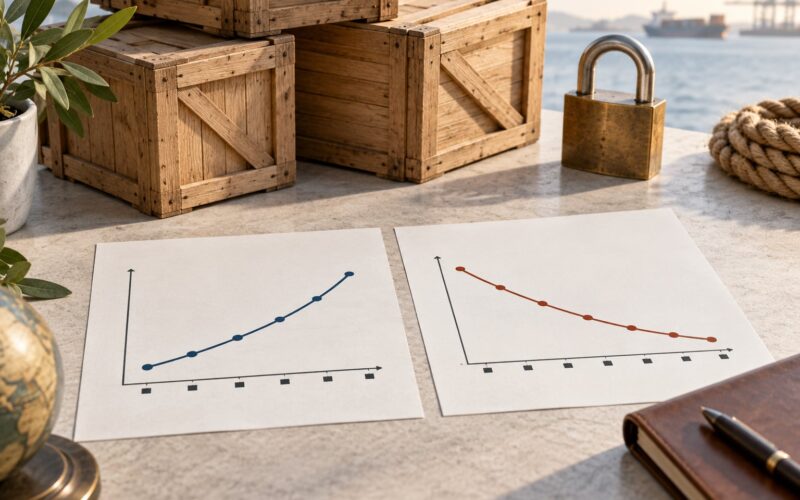
Contango is when later-dated futures cost more than earlier ones, so every roll up the curve is a sale at a lower price and a purchase at a higher one. Backwardation is the reverse: later-dated futures cost less, so each roll sells high and buys lower, and the difference accrues to the fund.
| Factor | Contango | Backwardation |
|---|---|---|
| Curve shape | Rising; later months cost more | Falling; later months cost less |
| Typical cause | Storage and financing costs exceed expected price gains | Current supply is tight, or holders want insurance against rising prices |
| Effect on the roll | Negative roll yield, a drag | Positive roll yield, a boost |
| Effect on fund returns | Lowers total return vs spot | Raises total return vs spot |
| Common setting | Calm markets, plentiful supply, easy storage | Supply disruptions, sharp demand surges, fear of a shortage |
The economic reason for backwardation is worth understanding, because it explains why a commodity index has historically paid anything at all. Producers who hold physical barrels or bushels of inventory would be exposed to a price spike if they stored the commodity. They will only accept that risk if the forward price is below spot, and that willingness to be paid a risk premium is exactly what backwardation measures.
So the normal long-run state for many commodities is mild backwardation, sometimes called normal backwardation. Contango is the state that hurts, and when you read that a broad commodity ETF has underperformed its spot index for years, contango is usually the reason.
Backwardation also shows up at the awkward times. When prices are falling sharply, the front contract can trade well above the deferred months, and a fund rolling into that curve gets a real boost in its roll line. This is one reason a commodity ETF can fall far less than the commodity in a crash — or occasionally rise more.
Why Roll Yield Is Not the Same as an ETF’s Price Return
The gap between a fund and the commodity it tracks is not a single mysterious cost. It is the sum of a price move, a curve effect, income on the cash the fund holds, and the fund’s expenses, and once you line those up the difference usually disappears.
The classic academic illustration is the long-run study by Gorton and Rouwenhorst of the S&P GSCI commodity index, which has been cited widely in the industry. Over their sample, roughly 6.4% a year came from collateral income, about 3.3% from roll yield, and the spot price change subtracted around 2.6%, giving about 7.1% annualized. Read that again: the commodity price itself was the component that dragged, and the roll was the one that helped.
Two things changed since that study period and are worth holding in mind. Interest rates are far higher, which has lifted the collateral line substantially for most futures funds. And the assets in commodity ETFs have grown enormously, which has been widely argued to make contango easier to sustain: more money chasing the same limited barrels and storage capacity means the arbitrage that would normally flatten the curve cannot always close the gap.
There is one more component people forget, and it is not small. A fund can hold futures on a commodity it never intends to deliver, and it does not have to put up the full contract value. The remainder sits in cash or short-term bills, and that is the collateral return. When rates are near zero, as they were through much of the 2010s, this line was close to nothing. That is a structural reason older commentary understates how futures ETFs have performed more recently.
The practical point is to compare like with like. A price return figure, a total return figure and a spot commodity index are three different things, and comparison sites are not always consistent about which they are showing.
How to Evaluate Roll Yield in a Futures ETF
You do not need terminal access or special data to do this properly. Seven steps get you most of the way, and they work for any futures-based fund you hold or are considering.
- Read what the fund actually holds. The prospectus and the fund’s holdings page should state whether it uses futures, physical barrels or equity companies. Only futures-based exposure has meaningful roll yield.
- Find the benchmark and its roll method. Funds differ between holding the front month, holding a fixed ladder of expiries, or using a rules-based schedule. The schedule is what converts the curve into a number.
- Compare the stated expense ratio against the roll line. A 0.75% fee on top of a 4% roll drag is a combined 4.75% headwind. Stacking them makes the product look expensive for a reason that has nothing to do with the manager.
- Look at the exchange curve, not the fund. The futures contracts trade publicly. Comparing the near month with the one after it tells you the direction and rough size of the roll return before the fund reports anything.
- Estimate the collateral yield. The cash backing the positions earns roughly whatever short-term bill yields are doing. Check the current three-month Treasury bill yield and use that as a fair proxy.
- Read the fund’s own tracking difference over a full year. If the spot index returned 8% and the fund returned 3%, that five-point gap is roll yield plus expenses plus tracking error, and you have found the drag without needing an estimate.
- Do not annualize a single month into a forecast. Curve shapes move constantly. A snapshot of today’s contango is a data point, not a forward-looking rate, and treating it as one is the most common error I see.
One point of reassurance for anyone who has wondered whether a sponsor is rolling badly on purpose: the price difference between contracts is set by the market, not the fund. A sponsor can choose to roll early or late and can choose a contract that has less liquidity, and those choices have a real cost, but they cannot conjure away a curve that sits in contango.
How Market Conditions Affect Futures ETF Results
The same four components behave very differently across regimes, and the curve usually follows the mood of the market more than the level of prices.
Rising rates. Collateral income improves, so part of the roll drag is offset. This is the friendliest combination for a futures-based fund: a positive roll plus strong bill yields.
Falling rates. The reverse. Collateral income shrinks, so the same roll drag eats a larger share of the total return, which is why older material describing futures ETFs as structurally impaired can look dated.
Commodity bull markets. Prices climb smoothly and the curve tends toward contango, because storage is easy when the market is calm. Holders get most of the spot move and give some of it back on the roll.
Commodity bear markets. Curve shapes get messy, and steep backwardation in some contracts can offset a portion of the losses. Investors who remember a commodity ETF falling less than the commodity in a downturn are usually recalling this effect.
Sudden shocks. Disruptions to supply, such as an outage or a blockade, tend to flip a market into backwardation quickly. That is the friendliest environment for a long futures position, and it can show up in the roll line before it shows up in the price line.
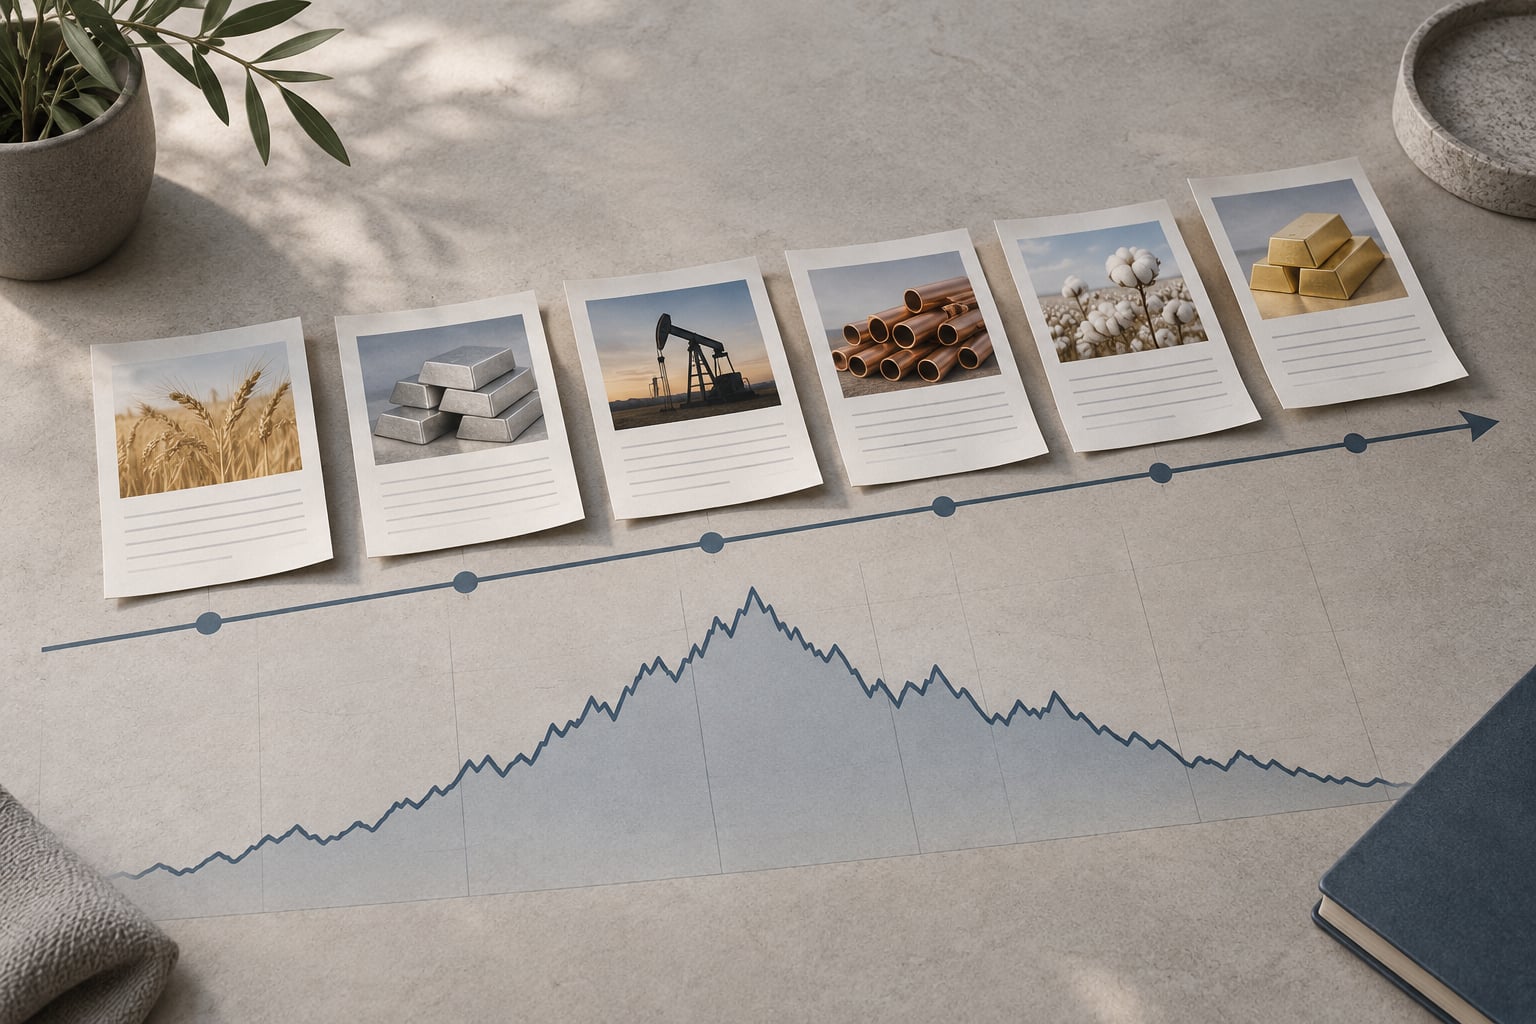
Seasonality and contract mix. Agricultural and energy curves carry their own seasonal patterns, and a broad index blends contracts that are in backwardation with contracts that are not. The net curve premium of the whole basket is what reaches the fund, which is why sector-level detail matters more than the headline commodity.
For funds outside commodities, the same logic holds. Volatility futures products roll through a term structure that has spent years in steep contango, which is the main reason those products have underperformed so persistently. Treasury futures funds behave differently again, since their curve shape is largely a function of the rate environment. Managed futures products apply the roll across a diversified basket of markets, so any single curve tells you very little about the fund as a whole.
Frequently Asked Questions
Is roll yield guaranteed?
No. Roll yield is a market outcome that changes with the futures curve, often from one month to the next. A fund that enjoyed positive roll yield last year can face contango this year and give the gain back. That is why anyone quoting you a single annual roll yield number is describing history, not a promise.
Why can a commodity ETF fall when the commodity price rises?
Usually contango. If the fund replaces an expiring contract with a more expensive one, the swap itself costs money, and that cost shows up as a negative roll return even when spot is climbing. Expenses compound the effect. This is the most common reason a rising commodity headline and a flat fund net asset value happen at the same time.
How do I calculate roll yield for a fund?
Take the difference between the near-month and next-month futures price for the underlying, express it as a percentage of the near-month price, and multiply by the number of rolls per year. Then compare that estimate with the fund’s stated expense ratio. The comparison matters more than either number alone, because both work against the holder.
Does roll yield affect every ETF?
No. Only funds that hold futures contracts experience a roll. A physically backed fund holds the commodity itself, and an equity-based commodity fund holds company shares, so neither has a roll return, though both carry their own tracking differences and expenses. The document describing the fund will say which structure it uses.
What happens when futures roll?
The fund sells the contract that is about to expire and buys the next one out on the curve. If the new contract costs more, the swap loses money; if it costs less, the swap earns money. For most commodity funds this happens roughly once a month, so the effect repeats and compounds across the year.
Is a managed futures or volatility ETF affected the same way?
Yes in mechanics, different in outcome. They still sell expiring contracts and buy further-out ones, so contango still hurts and backwardation still helps. The difference is the underlying curve. Volatility term structure has sat in steep contango for years, which has been a persistent drag, while a managed futures fund rolls a broad basket whose net curve premium is far less predictable.
Conclusion
Start with one number: put the fund’s total return next to the commodity’s spot return over the same period, and the gap tells you how much the curve and the fees took. Then read the fund’s benchmark to find its roll schedule, look at the exchange curve for the underlying to see which way it currently leans, and check the short-term bill yield to size the collateral line against the drag.
Once you can do that in about five minutes, how futures roll yield affects ETF returns stops being a mystery and becomes one line in a return decomposition. It is a real cost or a real tailwind, it changes with the market rather than with the manager, and it deserves to be weighed against the expense ratio. This is general information, not a recommendation to buy or sell anything.