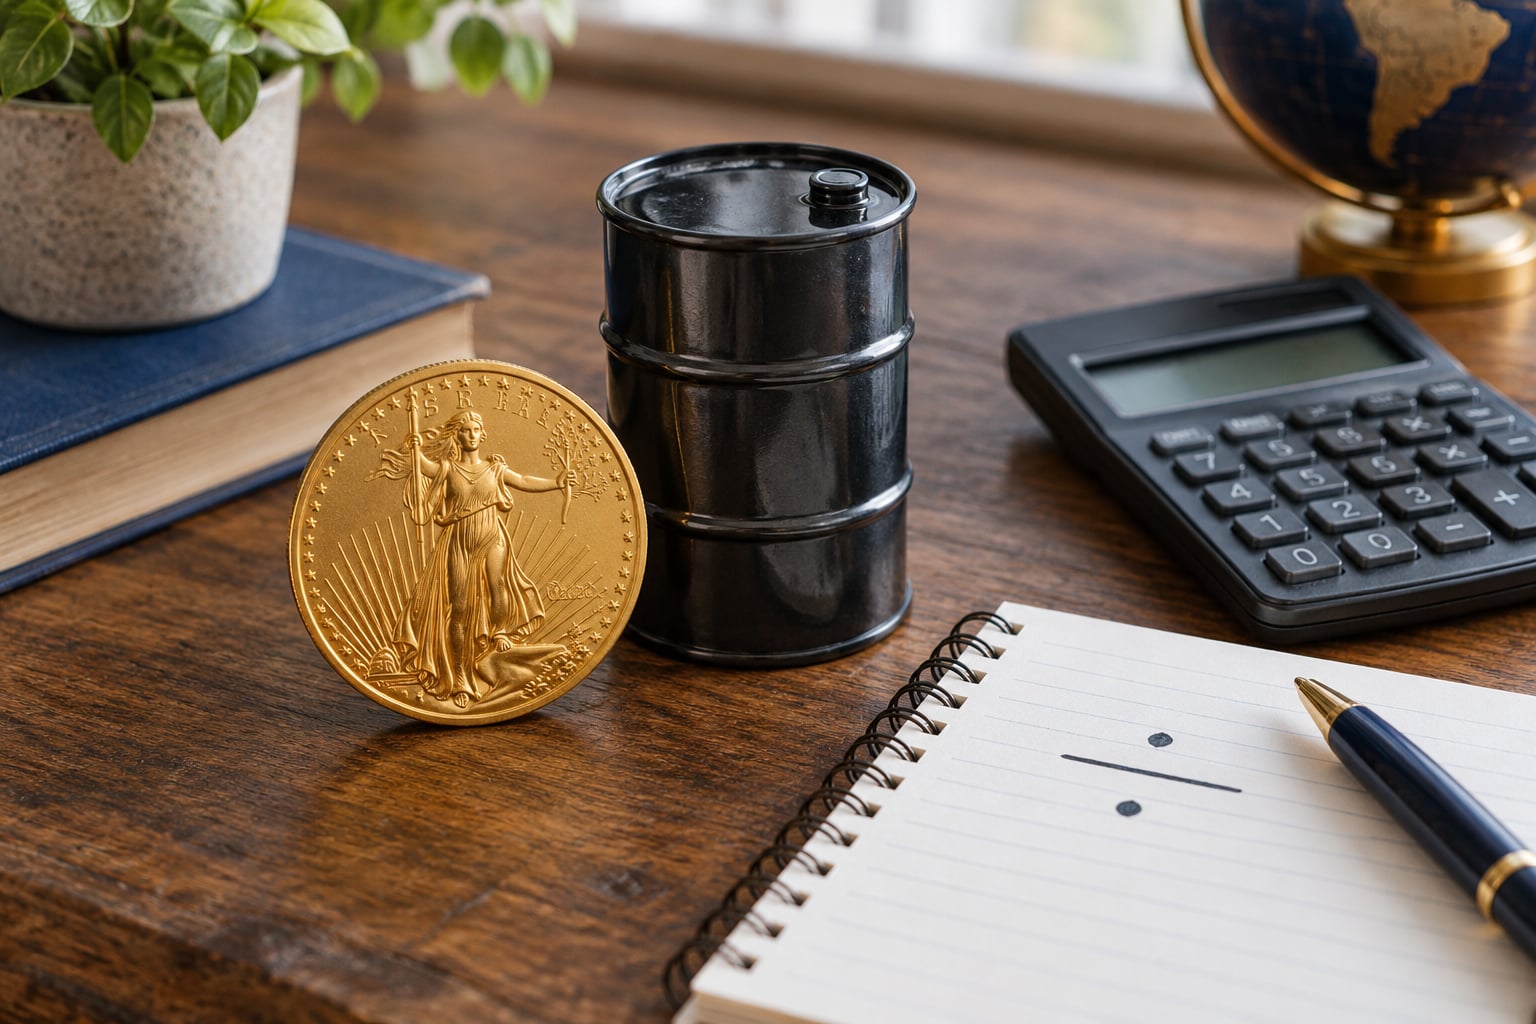
The gold to oil ratio is how many barrels of crude oil one troy ounce of gold can buy, worked out by dividing the gold spot price by the price of a barrel of WTI or Brent crude. Since 1970 the number has averaged roughly 15 to 20 barrels per ounce, so a reading of 30 says gold is expensive relative to energy and a reading of 10 says the reverse. Treat it as context, not as a buy signal on its own.
Here is the short version most people are after:
- Calculation: gold spot price divided by the price of one barrel of crude, giving barrels of oil per troy ounce of gold.
- Long-run average: about 15 to 20 barrels per ounce since 1970, with roughly 80 percent of observations inside a 10:1 to 30:1 band.
- High reading, above 25 to 30: oil looks cheap against gold, usually because energy demand is weak or safe-haven demand for gold is strong.
- Low reading, below 10: oil looks expensive against gold, usually because crude has spiked on a supply shock while gold stayed put.
What follows is the longer version: what the units actually mean, how to read a high or low number, what the extremes have looked like, and how you would track the ratio if you wanted to use it. None of this is individual investment advice, and commodity prices change by the hour, so always check a live quote before drawing conclusions.
Table of Contents
- What Is the Gold to Oil Ratio?
- How to calculate the gold to oil ratio
- Gold to oil vs oil to gold vs gold to silver
- How Do You Read a High or Low Gold to Oil Ratio?
- Why Do Investors Watch the Gold to Oil Ratio?
- What the ratio means for gold mining margins
- What Has a High or Low Gold to Oil Ratio Historically Signaled?
- How Can You Use the Gold to Oil Ratio in Practice?
- What Are the Limitations of the Gold to Oil Ratio?
- Frequently Asked Questions
- Does a high gold to oil ratio mean I should buy gold?
- Can the gold to oil ratio predict recessions or inflation?
- Should I use spot gold and crude oil prices, or futures prices?
- Why can the ratio change even when both gold and oil rise?
- What other indicators should I check alongside the gold to oil ratio?
- Which is more valuable, gold or crude oil?
What Is the Gold to Oil Ratio?
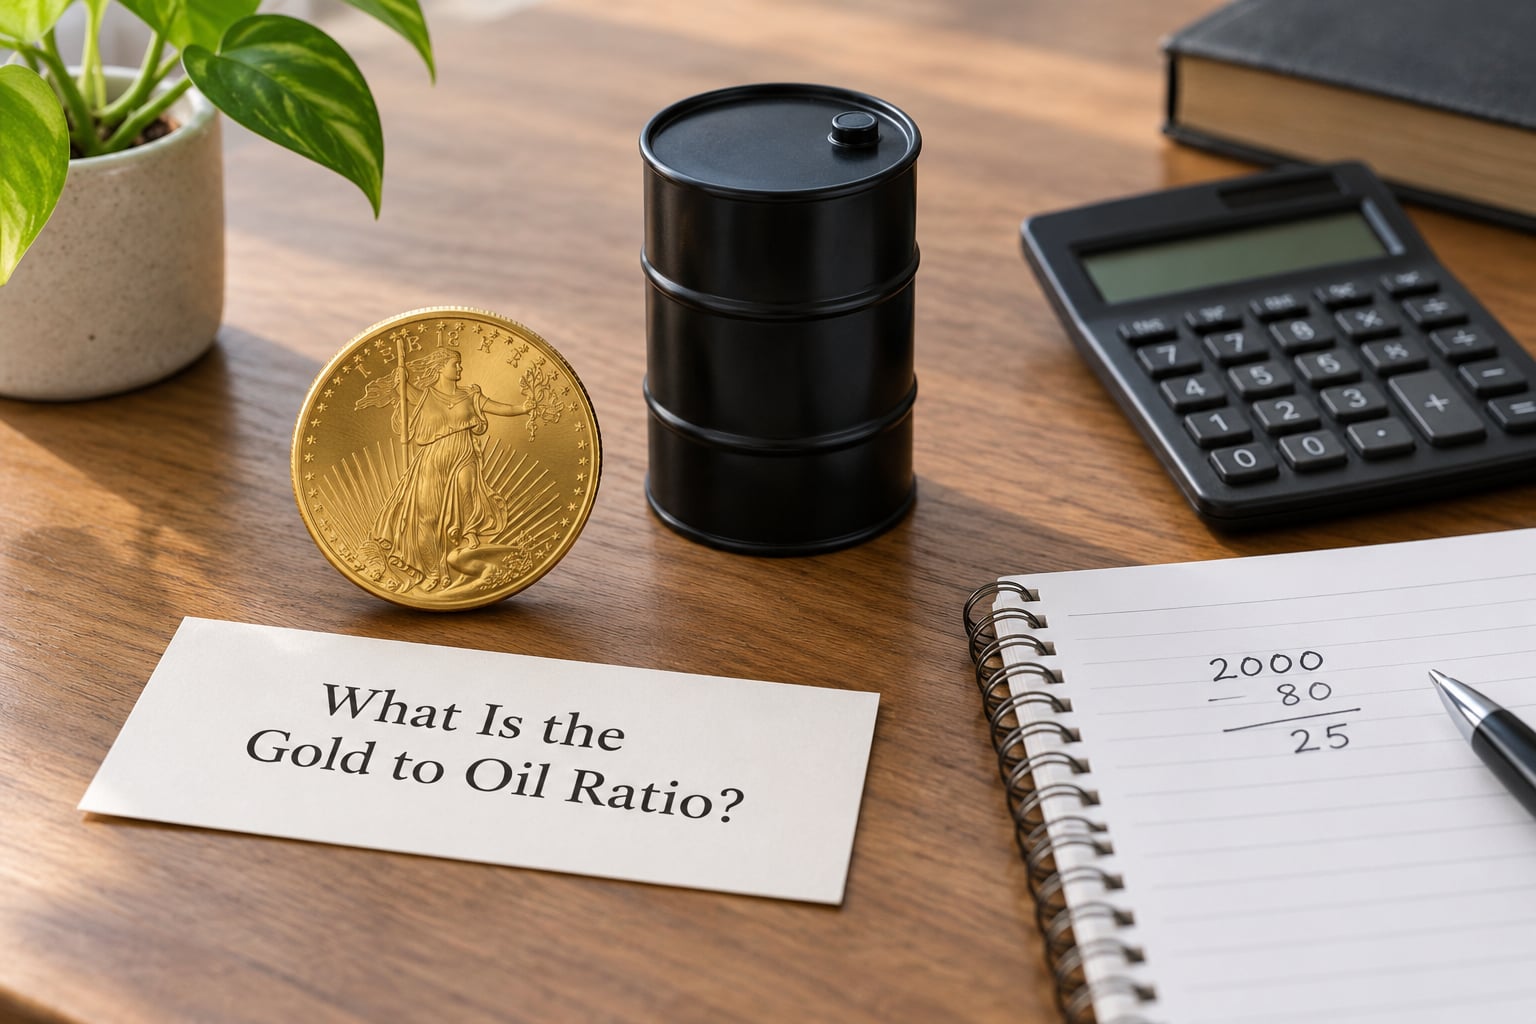
The gold to oil ratio measures the energy-buying power of gold. Take the price of one troy ounce of gold, divide it by the price of a single barrel of crude, and the result is the number of barrels your ounce of gold could purchase at that moment. A reading of 25 means one ounce of gold buys 25 barrels.
Both legs are quoted in US dollars, which is the whole point. Because gold and oil are priced in the same currency, the dollar cancels out of the division, and what you are left with is a cleaner comparison of the two commodities than either price series gives you on its own.
The units are worth being precise about, because a lot of confusion online comes from mixing them up. Gold is quoted per troy ounce, which is 31.1035 grams. Crude is quoted per barrel, a 42-gallon US unit. A troy ounce is roughly 1.44 US gallons, so the ratio is really comparing a small precious-metal weight with a large volume of fuel.
Some charts run the calculation in reverse, showing ounces of gold per 100 barrels of oil. On that scale the long-run average is about 6.2 ounces per 100 barrels dating back to the 1890s and about 6.6 since gold prices floated freely in 1969, and the Covid crash pushed it down to roughly 0.78. The two versions describe the same relationship, so when a page claims the ratio is a particular number, check the units before you compare it to anything else.
How to calculate the gold to oil ratio
Four steps, and you can do all of it in a spreadsheet:
- Get the spot gold price in US dollars per troy ounce, the figure usually quoted as XAU/USD.
- Get the crude price in US dollars per barrel. Pick WTI or Brent and use the same benchmark every time you compare readings.
- Divide the gold price by the crude price.
- Write down the date, the benchmark and the source next to the result so you can reproduce it later.
A round-number illustration: if gold is quoted at 3,000 an ounce and WTI at 70 a barrel, the calculation is 3,000 divided by 70, which is about 42.9, so roughly 43 barrels per ounce. Those inputs are placeholders rather than a live market quote, but the arithmetic is exactly what you would do with real prices. Change the oil price and watch how fast the answer moves.
One practical note. If you intend to track the ratio rather than just read it once, use the same two series every time. Switching between WTI and Brent, or between spot gold and a futures contract, silently changes your number without changing anything about the market.
Gold to oil vs oil to gold vs gold to silver
Three ratios get tangled together, and only the first two are the same measure written two ways.
| Ratio | What it measures | Typical use |
|---|---|---|
| Gold to oil (barrels per ounce) | How many barrels of crude one troy ounce of gold buys | Macro stress, energy-market stress, relative cheapness of gold against energy |
| Oil to gold (grams of gold per barrel) | The same relationship inverted | Convenient when you think in small gold weights; identical information |
| Gold to silver | Ounces of silver one ounce of gold buys | A precious-to-precious comparison, unrelated to energy costs |
If a source says the ratio is 5, one of two things is going on. Either it is using the inverted scale of ounces per 100 barrels, or it is mixing the ratio up with a gold to silver number. Neither is a reason to distrust the source, but it is a reason to check the labels before you act on the figure.
How Do You Read a High or Low Gold to Oil Ratio?
A high ratio is not automatically good news for gold holders, and a low one is not automatically a warning. The number only tells you which leg moved more, so the first question is always: what is driving the change?
| Reading | Plain-language meaning | Typical drivers |
|---|---|---|
| Below 10 | Oil is expensive relative to gold | Supply shocks, OPEC supply cuts, a sudden demand rebound, flat gold |
| 10 to 25 | The range where most history sits | Normal growth and inflation conditions, both legs moving together |
| 25 to 30 | Oil is cheap relative to gold | Weak industrial demand, strong safe-haven gold buying, rising real interest rates |
| Above 30 | Historically unusual | Extended stress, heavy central bank gold buying, or a collapse in the oil price |
Four combinations produce the moves you will see most often.
Gold rises while oil falls. The ratio climbs because the numerator gains and the denominator loses. This is the classic stress pattern, and it is what a flight to safety looks like when the growth outlook is deteriorating at the same time.
Oil rises while gold falls. The ratio drops. A supply-driven oil spike combined with risk appetite returning to risk assets produces this, and it is the configuration that most often gets mistaken for cheapness.
Both rise, but oil rises faster. The ratio falls even though nothing has gone wrong. Commodity-wide inflation moves both legs, and the denominator simply outran the numerator.
Both fall, but gold falls faster. The ratio falls too, for the same arithmetic reason in reverse. A ratio move is a statement about relative speed, not about direction or quality.
That last point is the one people skip. Before drawing any conclusion, check which commodity actually moved.
Why Do Investors Watch the Gold to Oil Ratio?
Because the two commodities sit at opposite ends of the economic cycle, and the ratio compresses that contrast into a single figure. Gold is a store of value with almost no consumption demand, while crude is an industrial input whose price is set by transport, manufacturing and electricity demand. When those two forces point in opposite directions, the gap between them says something about the state of the economy.
The main channels people track are these.
- Dollar conditions. Both prices are quoted in dollars, so dollar strength moves the denominator and numerator together. The ratio strips that shared effect out and leaves the commodity-specific story.
- Safe-haven demand. Gold buying tends to rise during geopolitical stress, banking worry and heavy official-sector purchases, and none of those things tend to lift crude at the same time.
- Inflation expectations. Energy carries weight in consumer price indices. When the energy component runs hot, the ratio tends to fall unless gold is rising even faster.
- Real interest rates. Higher real rates raise the opportunity cost of holding a non-yielding metal, which usually pushes gold down and the ratio up when oil is stable.
- Energy-market stress. OPEC supply policy, pipeline outages and shipping disruptions move crude sharply and briefly, which is exactly the kind of event that shows up as a sharp move in the ratio.
- Relative commodity performance. In a broad commodity upswing, the ratio tells you which leg is leading, which is useful context for sizing exposure to either side.
It is a context indicator rather than a valuation model. It tells you how gold and energy are pricing relative to each other, and it does not tell you which of the two is correctly priced.
What the ratio means for gold mining margins
This is the most concrete commercial use of the number today. Diesel and power are a large share of a miner’s operating cost, and diesel is a refined product priced off crude. A high ratio means the gold price is strong while the oil price is weak, so revenue per ounce rises and fuel cost per tonne falls at the same time. That combination is what recent wire coverage was describing when it linked record gold to oil ratios to unusually wide miner margins.
Watch it alongside all-in sustaining costs rather than in place of them. A wide ratio can persist for years, and a miner with rising grades or a new pit can post record margins at any ratio. Treat the reading as a tailwind or headwind on the cost line, then check the company’s own numbers.
What Has a High or Low Gold to Oil Ratio Historically Signaled?
The historical record is easier to read as a set of conditions than as a set of exact numbers, because the benchmark, the contract and the currency have all changed over time. The bands below are the ones most market commentary uses, with approximate readings rather than false precision.
| Period | What was happening | Approximate reading | What it suggested |
|---|---|---|---|
| Late 1970s to early 1980s | Oil supply shock, oil-embedded inflation, second oil shock | Near the bottom of the range | Energy was capturing the inflation premium while gold had not caught up |
| 2008 financial crisis | Credit freeze, industrial demand collapse, flight to safety | Roughly 25 to 30 | Gold bid, oil crushed, the ratio broke to the upper end of its band |
| April 2020 | Negative WTI in the US market as storage filled | Near 90 on a negative denominator | A mathematical artefact of a negative oil price, not a meaningful signal |
| Covid crash, same period | Historic liquidity squeeze | About 0.78 ounces per 100 barrels on the inverted scale | Everything sold at once, including gold, before safe-haven demand returned |
| The most recent gold bull market | Record gold prices alongside soft energy demand and heavy official-sector buying | Second-highest stretch in the modern record on most measures | Gold and oil being driven by largely separate narratives |
Two honest observations from that record. First, the April 2020 reading should never be used as a normal target. A negative denominator produces a negative ratio or an absurdly large positive one depending on how the calculation is written, and those numbers still get quoted online as if they mean something.
Second, the stability argument cuts both ways. A chart posted in r/EconomyCharts makes the case that the ratio held inside a narrow band for close to a century before breaking sharply higher in recent years. Whether that is a structural break in the relationship or a long mean-reversion process that has not finished is genuinely unsettled.
What a ratio extreme can tell you is that gold and oil are being priced by different forces than usual. What it cannot tell you on its own is whether that state reverses quickly or persists for years. Extremes and regime changes are different things, and conflating them is the most common mistake in reading this indicator.
How Can You Use the Gold to Oil Ratio in Practice?
A repeatable process matters more than any single reading. Here is one that takes about ten minutes a week.
- Fix your inputs. Choose spot gold and one crude benchmark, WTI or Brent, and write them down. If you want a futures-based view instead, use the front-month contract on both legs and stay with it.
- Calculate and date it. Record the ratio, the date and the source. An undated number is close to useless because the inputs move daily.
- Place it against history. Compare with the 15 to 20 barrel long-run average and with the 10 to 30 band that contains most observations. A percentile or a gap-to-average figure gives you more than a raw number.
- Identify the driver. Work out which leg moved. Gold up and oil flat is a different story from oil down and gold flat, even when both produce a ratio of 28.
- Cross-check the macro picture. Compare with inflation expectations, policy rate expectations, the dollar index, energy inventories and equity market breadth.
- Look for confirmation elsewhere. Check the gold to silver ratio and gold against broad equity indices. When three separate relative-value measures agree, the reading is doing more work than one number alone.
For tracking, a two-column spreadsheet with dates in the first column and the ratio in the second is enough to start. Add a column for whichever of gold or oil moved less, and the driver column writes itself after a few months.
Charts and screeners can do the arithmetic for you, and the usual approach is to divide the gold ticker by the crude ticker on a charting platform. A word of caution from the community: charts circulating on social platforms are frequently static and undated, and a chart without a date stamp or a named source is not a data point.
What Are the Limitations of the Gold to Oil Ratio?
It is one number built from two different businesses, and the seams show in several places.
Units and denominators. A troy ounce of gold and a barrel of crude are unrelated physical quantities. The ratio works because we treat prices as abstract, not because the two goods have anything in common. Read backwards, or in grams per barrel, the same relationship can look like four different numbers.
Spot versus futures. Futures curves contango or backwardation changes the front-month price without anything changing in the physical market. Mixing spot gold with front-month crude, or comparing one source that uses futures with another that uses spot, produces phantom differences of several percent.
Different trading hours and market structures. Gold trades nearly around the clock while crude has set hours and a physical delivery market with storage constraints. That gap is exactly what produced the negative WTI episode, and it will produce other one-off distortions.
A changing oil market. Shale supply, OPEC policy and the energy transition have altered how crude responds to growth. A relationship calibrated on post-1970 data is being applied to a market that no longer behaves the way it did when the average was set.
Decoupled narratives. The pain point raised most often by people who follow the ratio is that its two legs are driven by separate stories. Gold responds to central bank buying, geopolitical risk and currency debasement, while crude tracks industrial demand and supply policy. When those diverge, the ratio moves for reasons on one side only.
No timing value. Some analysts argue gold leads oil by roughly twenty months, which would be useful if it were reliable. Lead and lag relationships in commodities are unstable, so treat any claimed lead as a hypothesis to test, not an input to a trade.
It is not a valuation model. A high ratio does not mean gold is overvalued, and a low one does not mean oil is. Both legs can be mispriced at the same time.
Given all that, the ratio earns its place as one line in a dashboard rather than a standalone system. Nothing here is a recommendation to buy or sell any asset, and market conditions change constantly.
Frequently Asked Questions
Does a high gold to oil ratio mean I should buy gold?
No. A high reading says gold has outpaced crude, not that gold is cheap or mispriced. The ratio can stay stretched for years when central bank buying supports gold while energy demand stays soft. Use it as one input alongside inflation expectations, real rates and the dollar, never as a standalone buy signal for either commodity.
Can the gold to oil ratio predict recessions or inflation?
It can describe conditions associated with both, but prediction is too strong a word. Wide ratios have often coincided with weak growth and safe-haven demand, while narrow ones have followed oil supply shocks. The number tells you which commodity is being bid. It does not tell you in advance whether a slowdown or an inflation acceleration is coming.
Should I use spot gold and crude oil prices, or futures prices?
Either is fine as long as you stay consistent. Spot gold divided by spot WTI or Brent is the standard headline calculation. Using front-month futures on both legs reflects what a trader could actually execute, but the futures curve adds a term that the spot ratio does not have. Never mix a spot gold price with a futures crude price and expect a comparable number.
Why can the ratio change even when both gold and oil rise?
Because the ratio is relative, not absolute. If gold gains 2 percent and oil gains 8 percent, the numerator barely moves while the denominator climbs, so the ratio falls even though both commodities went up. A useful way to read any move is to ask which leg changed more, since that is the only thing the ratio actually measures.
What other indicators should I check alongside the gold to oil ratio?
Check the drivers behind both legs: inflation expectations, policy rate expectations, the US dollar index, crude inventory data and energy-sector earnings. For relative-value confirmation, the gold to silver ratio and gold against broad equity indices add independent information. A reading that three measures agree on carries more weight than the same number on its own.
Which is more valuable, gold or crude oil?
The two answer different questions. Gold holds value across time and carries no consumption demand, so its price is set by savings, fear and currency confidence. Crude is consumed the moment it is burned, so its price is set by the cost of replacing supply. The gold to oil ratio is useful precisely because it puts those two pricing systems side by side.
Start with one line of work: divide today’s gold spot price by one crude benchmark, date the result, and write down which of the two moved most. That single habit, repeated monthly, tells you far more than any historical average quoted without a source, and it keeps a genuinely useful macro gauge from turning into a number you act on without reading it properly.