The Dow to Gold ratio is the Dow Jones Industrial Average’s level divided by the price of one troy ounce of gold, and the result tells you how many ounces of gold it would take to buy one unit of the Dow. A high reading means stocks are expensive relative to gold; a low reading means gold is expensive relative to stocks.
That is the whole formula, and most of the confusion around this indicator comes from people expecting it to do something it was never built to do. It is a slow, decade-scale measure of relative performance, useful for judging how stretched stock valuations have become against hard money. It is not a timing tool, and treating it as one is the single most common beginner mistake.
This guide walks through the calculation, the historical extremes, the signals worth cross-checking, and a repeatable research routine. Figures quoted for the current reading are dated, because the two inputs move every trading day and an undated ratio is worthless.
Table of Contents
- What Is the Dow to Gold Ratio?
- What the Dow number on your screen actually is
- Why the ratio is quoted in troy ounces
- How to Read the Dow to Gold Ratio
- Ratio ranges and what each one has historically meant
- Four things to look at on the chart
- How to Calculate the Ratio Step by Step
- Step 1: get the Dow closing level
- Step 2: get one gold price series and stay with it
- Step 3: divide and sanity-check the answer
- What Does a High Dow to Gold Ratio Mean?
- What Does a Low Dow to Gold Ratio Mean?
- How to Compare the Ratio With Other Market Signals
- How to Use the Dow to Gold Ratio in a Research Process
- Chart it, do not quote it
- Separate the drivers
- Write the context down before you interpret
- Know what it cannot do
- Common beginner mistakes
- Frequently Asked Questions
- What is the Dow to gold ratio?
- What is the current Dow to gold ratio?
- What does a high Dow to gold ratio mean?
- What does a low Dow to gold ratio mean?
- Is the Dow to gold ratio a reliable timing signal?
- How do I check the Dow to gold ratio myself?
- Conclusion
What Is the Dow to Gold Ratio?
The ratio answers one question: how much gold would it cost to own a unit of US stock market wealth? When the Dow trades at 53,459 and gold trades near 4,400 dollars an ounce, the ratio is roughly 12.2 ounces of gold per Dow point.
Because it is quoted in ounces per Dow point, the number itself is not a valuation. It only means something once you compare it with where the ratio has been before.
What the Dow number on your screen actually is
The Dow Jones Industrial Average is a price-return index of 30 large US companies, which means two things matter for anyone using it in a ratio. Dividends are excluded, so the ratio compares gold’s total return against stocks’ price return only, and gold therefore looks progressively better the longer you extend the chart.
Composition is not fixed either. The index launched in 1896 with a dozen industrial names and has been swapped repeatedly since, so a century-long Dow to gold chart compares today’s companies against 1920s railroads and 1930s chemicals. The long-run trend is still informative, but treat exact historical comparisons as approximate.
Why the ratio is quoted in troy ounces
Gold trades in troy ounces, roughly 31.1 grams, not in the avoirdupois ounces used for ordinary weight. Mixing the two is one of the easiest ways to get a wrong number, so check the unit before you divide.
How to Read the Dow to Gold Ratio
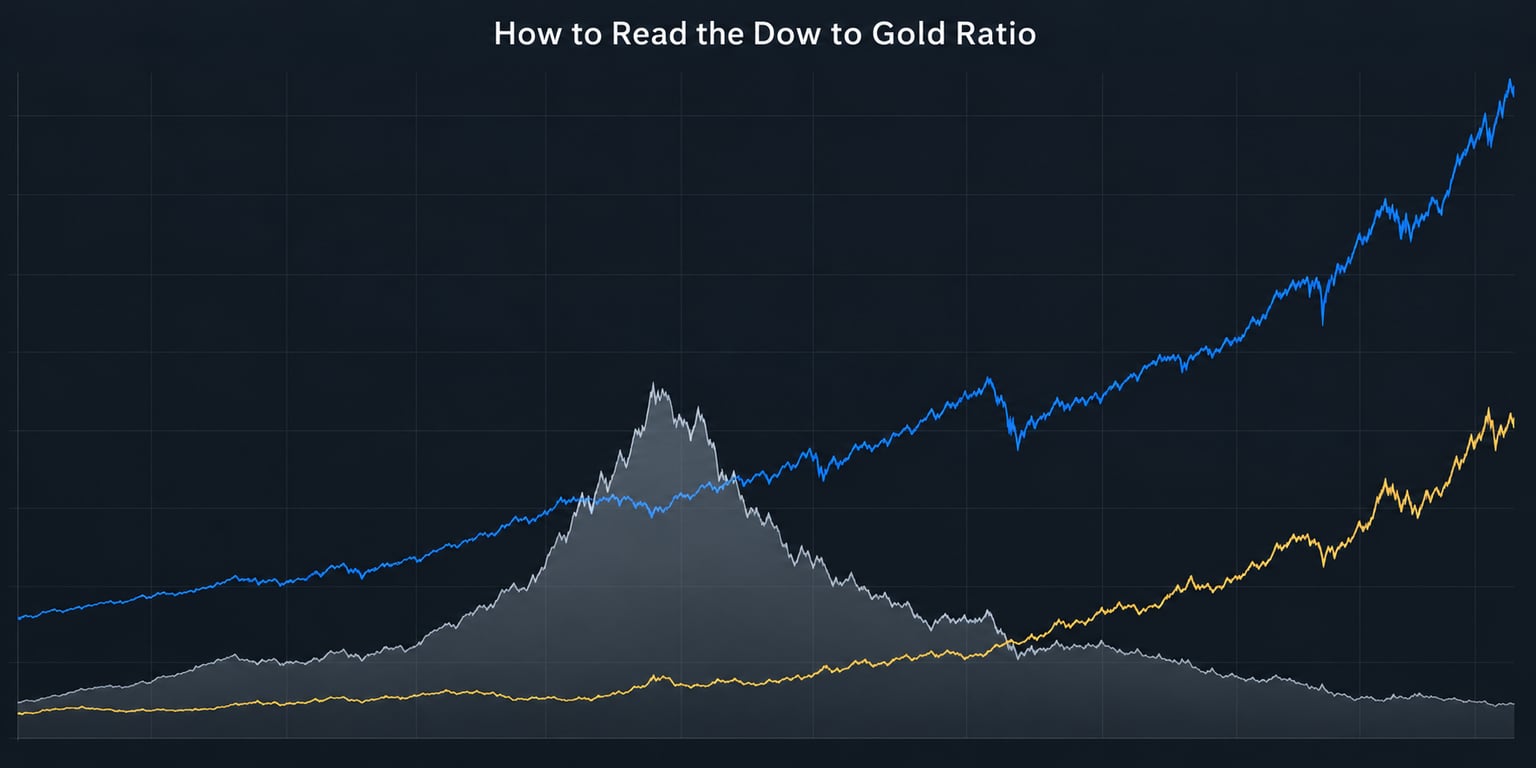
Reading the Dow to gold ratio comes down to three things: where the number sits against its own history, which direction the line is travelling, and whether gold or the Dow is driving the move. The ranges below are approximate bands drawn from twentieth-century history, useful as orientation rather than as trading thresholds.
Ratio ranges and what each one has historically meant
| Ratio range | Plain-English reading | Typical backdrop |
|---|---|---|
| Above 22 | Stocks are extremely expensive measured in gold | Late-cycle optimism, easy money, valuations running ahead of earnings |
| 12 to 22 | Stocks hold a clear premium over gold | Normal risk-on conditions |
| 6 to 12 | Stocks and gold are in the same neighbourhood | Transition periods, choppy regimes |
| Below 6 | Gold is expensive relative to stocks | Crisis fear, recession anxiety, debasement worries, or a generational equity bottom |
A ratio near 12 in 2026 sits in the middle of that structure, which is neither a warning nor a signal by itself. It only becomes interesting when you can name what is pushing it.
Four things to look at on the chart
- The secular uptrend. Across more than a century the ratio rises steadily in gold’s favour even though both series climb, because a price-return stock index and a fixed supply of gold are not comparable claims on the economy.
- The 1999 peak at roughly 43 ounces. This is the reference point most analysts anchor to, and a ratio that has to fall far below current levels to revisit it is the reason some readers treat the last quarter-century as a valuation regime rather than a normal cycle.
- The descending line through cycle lows. Troughs came in around 1.9 ounces in 1933 and 1.3 ounces in 1980, roughly halving across the century. Connecting those lows gives a secular line that has held up remarkably well.
- The scale you are viewing. Use a logarithmic scale for the long history. On a linear scale the last three decades compress into a flat line at the top and you lose the structure that made the early twentieth century readable at all.
How to Calculate the Ratio Step by Step
The arithmetic is one division, and the real work is choosing inputs you can reproduce. Use the numbers from the guide below with the two prices printed next to them, so you can verify the result rather than trusting it.
Step 1: get the Dow closing level
Take the official closing level of the Dow Jones Industrial Average, not an intraday quote and not a futures contract. The Federal Reserve Bank of St. Louis publishes the daily series as DJIA on FRED, and Macrotrends carries the same history in an easier-to-read table.
Step 2: get one gold price series and stay with it
Pick spot gold in US dollars per troy ounce and use the same series every time you check. Mixing LBMA spot with COMEX futures changes the answer, which is a recurring source of arguments in online trading forums where two people quote different ratios for the same day.
Gold futures lead spot, so a futures-based ratio will read slightly higher than a spot-based one on any given afternoon. Neither is wrong. Being inconsistent is the problem.
Step 3: divide and sanity-check the answer
Here is a full worked example using figures published in late September 2026, when a Kitco piece on the ratio put the Dow near 53,459 and gold near 4,400 dollars an ounce.
53,459 divided by 4,400 equals 12.15 ounces. Round to 12.2 ounces of gold per Dow point. The same source noted the ratio had fallen from roughly 19 ounces in early 2024, which means the Dow declined against gold over that stretch, or gold rose faster, or both.
Sanity checks are quick. The answer should be a number roughly between 1 and 50 for any post-1930 date, and if you get something like 0.5 you have probably entered the gold price in dollars per gram.
What Does a High Dow to Gold Ratio Mean?
A high Dow to gold ratio means stock wealth is expensive measured in ounces of gold, which is a relative statement about pricing rather than a prediction that stocks will fall. Peaks in the twentieth century lined up with periods of monetary expansion and generous equity valuations.
| Period | Dow level | Gold price per ounce | Approx. ratio | What followed |
|---|---|---|---|---|
| September 1929 | about 381 | about 20 | about 19 | The onset of the Great Depression |
| February 1966 | about 785 | about 28 | about 28 | A tightening cycle and a gold market that had been fixed by policy since 1934 |
| Mid-1999 | about 11,400 | about 264 | about 43 | The equity peak, followed by a bear market in stocks while gold rose |
Three drivers explain most high readings. Expanding money supply lifts nominal asset prices faster than the gold price in a fixed-supply asset, easy credit drives valuations, and shifting away from a constrained gold market removes the old cap on how high equities could go relative to it.
The 1999 case is the cleanest test of the indicator’s limits. The ratio peaked in 1999 and did not fully invert until roughly 2011, which is thirteen years. That is the argument against using the Dow to gold ratio to time entries. A signal that takes over a decade to resolve is an allocation tool, not a trigger.
The same high number can support opposite conclusions. A bull reads it as proof that equities still have room to run in a strong economy, while a bear reads it as an equity bubble that has already inflated far past what earnings can justify. Both readings come from the same figure, which is why context matters more than the level.
What Does a Low Dow to Gold Ratio Mean?
A low ratio means gold has outrun the Dow, usually because investors are paying up for the metal while discounting equities. Troughs cluster around periods of recession, monetary debasement, or deep pessimism about paper assets.
| Period | Dow level | Gold price per ounce | Approx. ratio | What followed |
|---|---|---|---|---|
| February 1933 | about 53 | about 27 | about 1.9 | Gold was later prohibited for private holding under Executive Order 6102, 1933 |
| January 1980 | about 905 | about 700 | about 1.3 | Volcker-era double-digit rates crushed the metals complex |
| Late summer 2011 | about 11,500 | about 1,880 | about 6 | A long period of range-bound equities and firm gold |
Falling real interest rates are usually doing the work. Gold pays no coupon, so the opportunity cost of holding it is the real yield on government debt, and when that yield turns negative the metal gets more attractive without anything changing about the physical supply.
Demand from central banks has also reshaped the floor under the metal. The World Gold Council has tracked official-sector buying in the high hundreds of tonnes annually in recent years, and those purchases rarely respond to price, which flattens the low end of the ratio compared with earlier decades.
Low readings also need a second look. A gold spike driven by panic tends to reverse once the fear passes, and an r/Economics discussion of generational cycles in this ratio made exactly that point, noting that gold can form its own bubble and distort the comparison. A low ratio caused by a collapsing gold price is a very different signal from one caused by a rising one.
How to Compare the Ratio With Other Market Signals
The ratio works best as one input among several rather than on its own. These are the cross-checks that most often confirm or contradict what the number is telling you.
- The US dollar index. Gold is priced in dollars, so a rising dollar usually pushes the ratio higher by holding gold down. If the ratio is falling because the dollar is surging, the equity story may be doing less work than the chart suggests.
- Real yields. Ten-year Treasury yields adjusted for inflation are the cleanest single check on gold. Rising real yields and a falling ratio in the same stretch is a coherent story; rising real yields with a falling ratio is a warning that something else is driving gold.
- Inflation expectations. The ratio prices long-duration assets against a store of value, so it sometimes anticipates consumer price data rather than following it. Breakeven rates give you an independent read on the same expectation.
- The CAPE ratio. Shiller’s earnings-based measure answers a different question: what are stocks worth relative to their own profits. Use it to judge how stretched equities are, then use the Dow to gold ratio to judge the same stretch against hard money.
- The gold to silver ratio. When gold is the strong asset, this tells you whether the move is precious metals broadly or gold specifically. A falling Dow to gold ratio with a rising gold to silver ratio is a gold story; both falling together is a metals story.
- The S&P 500 to gold ratio. The S&P version is a reasonable sibling and many readers prefer it because 500 companies are a broader sample than 30. It runs at a different absolute level, so compare it to its own history rather than to the Dow number. There is no single published “correct” S&P to gold figure on any given day, since feeds differ.
- Rolling correlation. When the one-year correlation between stocks and gold turns negative, gold is doing something different from the equity market, which matters more for portfolio construction than the ratio’s level does.
How to Use the Dow to Gold Ratio in a Research Process
A repeatable routine matters more than any threshold, because the same reading means different things in different decades. Here is the sequence I would use.
Chart it, do not quote it
Pull the daily series, plot the ratio, and set it to logarithmic if you are looking back more than a few decades. Then draw the secular uptrend line and the line connecting cycle lows, and see where the current value sits relative to both.
Separate the drivers
Ask what moved. If the ratio dropped, was the Dow down, was gold up, or did both move? Decomposing the change tells you whether you are looking at an equity event, a metals event, or a genuine change in the relationship between the two.
Write the context down before you interpret
Note the policy backdrop, the level of real yields, and the dollar trend at the time of the reading. Two identical ratio readings from 1980 and from a modern credit expansion mean completely different things, and a dated note is the only way to tell them apart later.
Know what it cannot do
The ratio is too slow to time a market, as the thirteen-year gap between the 1999 peak and its eventual inversion shows. It is also not inflation-adjusted, so it drifts upward over time and comparisons across a century need that caveat. Where it does earn its place is allocation calibration: noticing that a stock-heavy portfolio has drifted to an extreme weighting, and treating the ratio as one prompt to rebalance rather than as a reason to sell everything.
The World Gold Council’s strategic allocation work puts a long-run metals weight in the low-to-mid single digits as a range rather than a point, and readers who want a rule of thumb can use a ratio extreme as a trigger to review their weighting, not to replace it.
Common beginner mistakes
- Mixing a live Dow quote with a gold price from earlier in the day, or combining spot and futures.
- Reading a high ratio as “sell stocks now” rather than as “stocks are expensive relative to gold.”
- Following mechanical rules such as “buy when the ratio drops below 5” without checking how long the signal would have taken to resolve. Plenty of users on leveraged-ETF forums treat the ratio as one input to a systematic rule, which is a different and more defensible use.
- Quoting a ratio with no date. On a chart-based discussion forum this is the fastest way to lose an argument.
This material is educational and general. It is not investment advice, and rules and market conditions change, so check current figures and consider your own circumstances before acting.
Frequently Asked Questions
What is the Dow to gold ratio?
The Dow to gold ratio is the level of the Dow Jones Industrial Average divided by the price of one troy ounce of gold. The result shows how many ounces of gold it would take to buy one unit of the Dow. A higher number means stocks are expensive relative to gold, a lower number means gold is expensive relative to stocks.
What is the current Dow to gold ratio?
The ratio changes every trading day because both inputs move. Late September 2026 figures put the Dow near 53,459 and gold near 4,400 dollars an ounce, giving roughly 12.2 ounces of gold per Dow point. Recompute it with today’s closing Dow and a single consistent gold price series, and always write down the date alongside the number.
What does a high Dow to gold ratio mean?
A high ratio means stock market wealth is expensive when measured in ounces of gold, which usually reflects monetary expansion, easy credit, and rich equity valuations. The most cited peak was roughly 43 ounces in 1999. It is a relative statement about pricing, not a prediction of a fall, and it took about thirteen years to fully invert from that peak.
What does a low Dow to gold ratio mean?
A low ratio means gold has outrun equities, typically during recession fears, falling real interest rates, or a shift toward holding hard money. Historical troughs include about 1.9 ounces in 1933 and 1.3 ounces in January 1980. Check the cause, because a low ratio driven by a collapsing gold price means something very different from one driven by a rising gold price.
Is the Dow to gold ratio a reliable timing signal?
Not on its own. The ratio is a slow indicator, and the 1999 peak to the 2011 inversion took roughly thirteen years to resolve. It is far better as an allocation and rebalancing prompt, and as a way to check how stretched equity valuations are against hard money, than as a signal for entering or exiting a market.
How do I check the Dow to gold ratio myself?
Take the official Dow close, published as the DJIA series by the Federal Reserve Bank of St. Louis on FRED, then divide it by a US dollar gold price per troy ounce from a single source you keep using, such as LBMA spot or a COMEX futures quote. Stay with one gold series, since mixing spot and futures produces a different ratio for the same day.
Conclusion
If you only check three things, check these. Look at the trend of the Dow to gold ratio on a log-scale chart, verify the two inputs and their date yourself, then confirm the move against real yields, the dollar, and the CAPE ratio before drawing any conclusion.
Used that way, the ratio does a job no other single number does, putting paper wealth next to hard money in one line. Used as a buy or sell trigger, it will frustrate you for years.