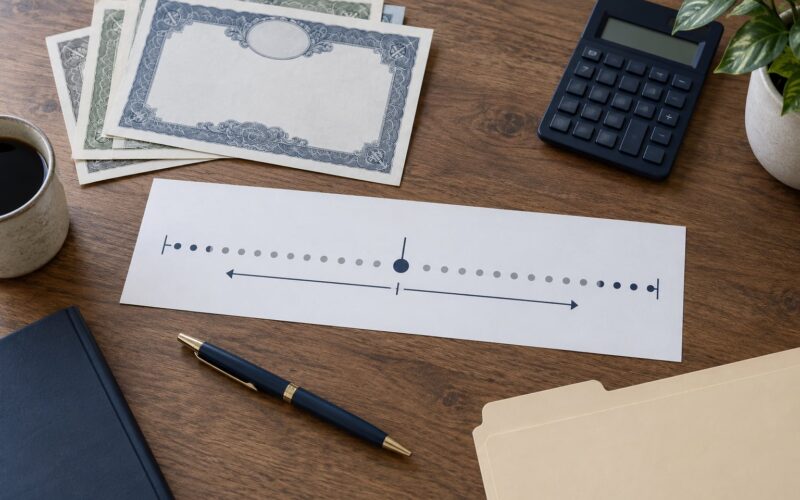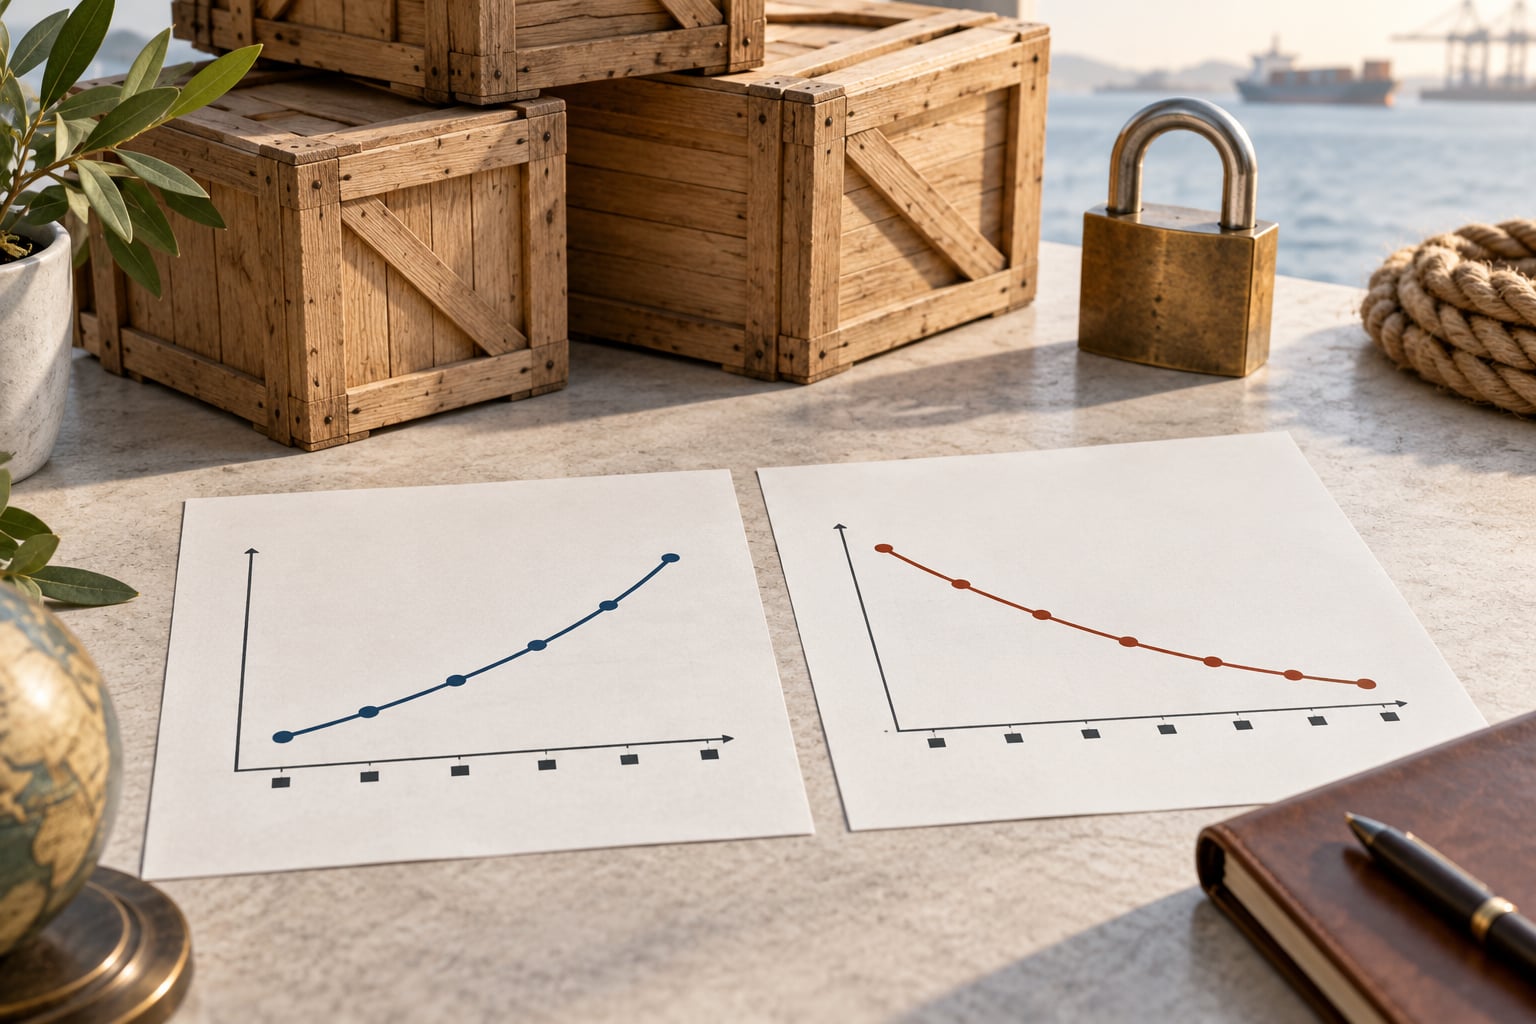
Contango and backwardation describe the shape of a futures curve. In contango, futures prices sit above the spot price and the curve slopes upward. In backwardation, futures prices sit below spot and the curve slopes downward, which is why it is also called an inverted curve.
That is the whole definition, but it is easy to read it as a prediction and get it backwards. A curve shape is a statement about relative prices, not a call on where a commodity goes next. This guide explains where each shape comes from, how it changes your returns, and how to read one on a live screen in 2026.
Table of Contents
- What Is Contango and Backwardation in Futures?
- How Does a Futures Curve Work?
- What Is Contango and Backwardation in Simple Terms?
- Why Does the Futures Curve Shape Matter to Investors?
- What Causes Contango?
- What Causes Backwardation?
- How Do Contango and Backwardation Affect Commodity Returns?
- How Do Traders Use the Futures Curve?
- What Are the Limitations and Common Misunderstandings?
- Frequently Asked Questions
- Is contango bullish or bearish?
- How are contango and backwardation different in futures trading?
- What happens when a futures contract reaches its delivery date?
- Do commodity ETFs rise when spot prices rise?
- Is backwardation always a sign of a commodity shortage?
- Conclusion
What Is Contango and Backwardation in Futures?
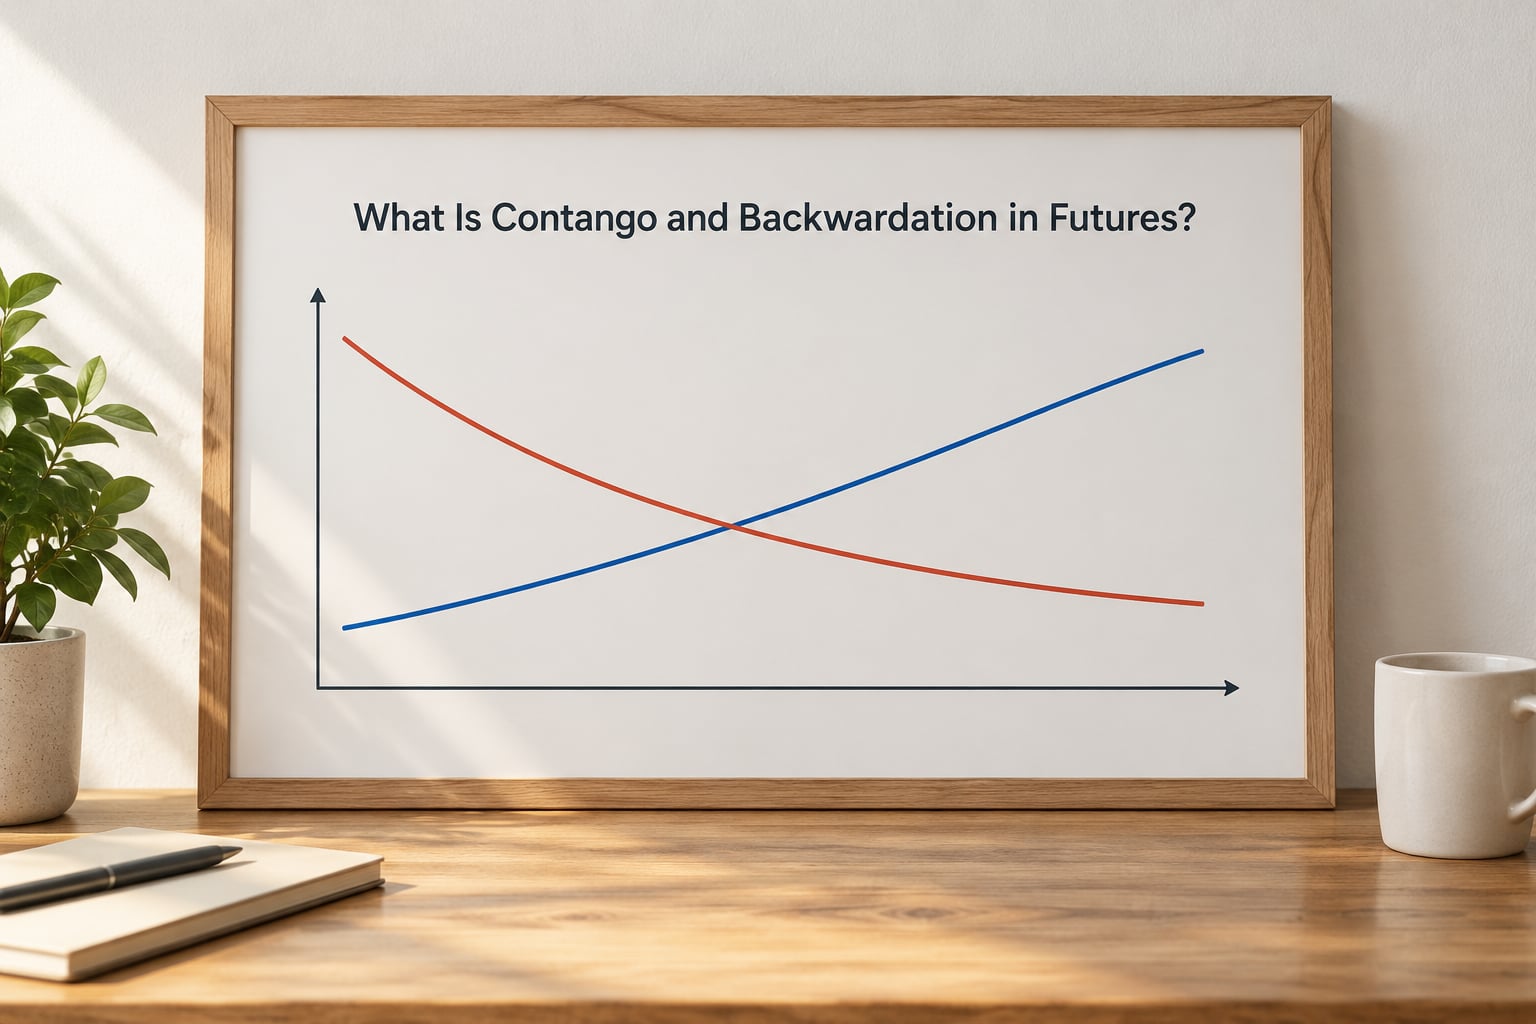
Contango is a market condition in which futures prices are higher than the current spot price, producing an upward-sloping futures curve. Backwardation is the opposite: futures prices are lower than spot, producing a downward-sloping or inverted curve. As each contract nears maturity, its futures price converges toward spot.
A third state exists that confuses people. A curve can sit in the middle, close to flat, or form a hump where the near months are backwardated while the far months are in contango. Crude oil has traded in that humped shape for years.
| Property | Contango | Backwardation |
|---|---|---|
| Curve shape | Upward sloping | Downward sloping, inverted |
| Futures vs spot | Above spot | Below spot |
| Main driver | Cost of carry: storage, insurance, financing | Convenience yield: scarcity and immediate demand |
| Typical reading | Loose market, surplus supply | Tight market, short supply |
| Roll implication for longs | Negative roll yield, a drag each cycle | Positive roll yield, a boost each cycle |
| Favours | Producers who store, cash-and-carry traders | Holders of the physical commodity |
How Does a Futures Curve Work?
A futures contract is an agreement to buy or sell something at a set price at a set delivery month. The spot price is what the thing costs right now, today. Plot the futures price for every delivery month on one axis and you get the futures curve, sometimes called the forward curve or term structure.
Two forces set the futures price. The first is what the market expects the spot price to be at delivery. The second is the cost of holding the physical thing between today and that delivery month, which traders call cost of carry: warehouse space, insurance, financing interest, and handling.
Put those together and the shape follows. When carrying costs are large relative to expected price appreciation, the curve tilts upward into contango. When the near months carry a scarcity premium that outweighs carry costs, the curve tilts down into backwardation.
One thing the curve is not: a guaranteed price forecast. The market publishes an expected future spot price for each month, but that expectation is revised constantly. A curve drawn this morning can look completely different by the afternoon.
What Is Contango and Backwardation in Simple Terms?
Contango means you pay more for a later delivery than for delivery now. Backwardation means you pay less for a later delivery than you do for delivery now. That is the whole analogy, and it holds for anything that can be stored and delivered late.
Say spot grain sits at 70 units and the six-month contract trades at 74. That gap of 4 units is contango, and it roughly covers what it costs to store, insure and finance that grain for six months. Nobody is predicting a 4-unit fall; the curve is charging you for the privilege of holding the physical stuff.
Now flip it. Spot gas sits at 70 units and the six-month contract trades at 66. That gap of 4 units is backwardation, and it says buyers want delivery soon enough to pay a premium for it. Scarcity today is worth more than the convenience of having the barrel in six months.
All figures in this article are illustrative units, not live quotes, so the arithmetic is easy to follow without implying any particular market level.
Why Does the Futures Curve Shape Matter to Investors?
Because nobody holds a futures contract forever. Every contract has an expiry date, and long before that date a position holding it must sell it and buy the next one out. That handover is called the roll, and it has a cost or a benefit depending entirely on the curve’s shape.
Roll in contango and you sell the cheap expiring contract and buy a more expensive one. You start the new cycle behind. Roll in backwardation and the reverse happens: you sell the richer contract and buy a cheaper one, and you begin the new cycle ahead.
This is roll yield, and it is the reason a commodity fund can lose money in a year when the commodity price rose. The spot price sets one return. The curve shape sets another, and the two can point in opposite directions for a full cycle.
Collateral income softens the blow. Funds hold cash or short-dated interest instruments against their margin, and the interest earned there adds a return of its own. In deep contango that income can offset part of the roll drag. It rarely wipes it out entirely.
What Causes Contango?
Contango usually appears when the physical market is loose. Supply is plentiful, inventories at warehouses are comfortable, and nobody is short a nearby delivery. With no urgency, the curve prices the carry costs and slopes up.
Storage and financing do most of the work. A warehouse full of a storable commodity is an expensive place to keep unsold inventory, so sellers demand compensation for parking it. When rates are high, financing costs alone can push a market into contango for months at a time.
Easy arbitrage between delivery months reinforces the shape. If the six-month contract trades far above the prompt contract, a cash-and-carry trader can buy the physical, finance it, store it and sell the deferred contract. That trade pulls the far month down until the gap is roughly covered by carrying cost.
Gold is the textbook example of a market that spends most of its time in contango. Warehousing and insuring bullion is expensive, nobody hoards it for its delivery month, and insurance premia rise as more metal piles up in vaults. The curve simply reflects that bill.
What Causes Backwardation?
Backwardation appears when buyers want the physical thing now more than they want it later. Tight supply, an immediate demand shock, or fear of a near-term disruption pushes the prompt contract above the deferred months.
Convenience yield is the formal name for that premium. It is the value of having the commodity in hand rather than a promise of it: no delay, no shipping queue, no risk of a refinery going offline. Exchange education material, including CME Group’s, describes convenience yield as an implied return on warehouse inventory that moves inversely with inventory levels. Lots in the vault, low convenience yield. Bare shelves, high convenience yield.
The second driver is expectations that supply will ease later. If a shortage looks temporary, buyers pay up for prompt barrels and refuse to extend that price further out. The curve inverts, and then straightens as new supply arrives or demand cools.
Short-term energy markets flip often because weather, outages and shipping disruptions arrive without warning. A cold snap or a pipeline closure can push a curve into backwardation within days, and it can slide back into contango just as fast once the disruption clears.
How Do Contango and Backwardation Affect Commodity Returns?
Walk through one year of holding a futures position in each environment. Start with 100 units of notional exposure and follow the contract that expires first, then the roll into the next one.
In contango, the front contract sits 8 units below the deferred contract. You sell the expiring contract and buy the replacement 8 units higher. Each roll subtracts roughly that spread from your position, so a year of holding through several rolls can bleed a meaningful share of your return even when the spot price rises.
In backwardation, the spread reverses. You sell the expiring contract 8 units higher than the replacement you buy, and each roll adds a small positive contribution. Over a full year of favourable rolls, that boost can lift your total return well above what the spot price alone delivered.
The confusion this causes is worth spelling out. Commodity funds track futures, not the warehouse. When a headline says the commodity rose, the fund can still underperform because its roll worked against it. Holding the physical asset removes that drag, but then you carry storage, insurance and handling bills yourself.
That is the trade-off in one line. The curve tells you which side of the carry transaction you are on.
How Do Traders Use the Futures Curve?
The curve is a working screen rather than a prediction tool. Traders use it to read pressure in the physical market, compare shapes across time and across assets, and size positions against the roll.
Reading a live curve starts with contract months. On most platforms the prompt month sits on the left and each following delivery month runs to the right. Compare the first two or three months against the year-out contract. Prompt higher means backwardation. Prompt lower means contango.
Next look at spreads. The prompt spread, usually written as the first month minus the second, captures the nearest squeeze or surplus. Calendar spreads between a near and a far month do the same thing at longer range, and they are how many traders express a view on the curve shape without taking outright directional risk.
Then compare against history. A curve that sat in contango for a year and flips to backwardation usually reflects a real change in supply and demand rather than noise. Options traders read the same curve as sentiment: shallow contango suggests calm, while backwardation points to a market paying up for protection.
The curve also shows up outside commodities. Interest-rate futures produce a term structure of rates, and volatility futures build an implied-volatility surface across future dates. Same vocabulary, same slope question, different underlying.
What Are the Limitations and Common Misunderstandings?
The biggest trap is treating curve shape as a forecast. Backwardation is not proof prices rise, and contango is not proof they fall. Both states persist for months while the underlying moves either way, because the shape is driven by relative prices across months rather than by direction alone.
Backwardation is not proof of a lasting shortage either. It shows a premium for prompt delivery right now. If new supply arrives next month, the premium collapses without the shortage ever becoming a real crisis.
Carry and convenience yield are also hard to pin down. Storage and financing costs can be estimated reasonably well, but convenience yield is inferred rather than observed, and different analysts will imply different values from the same curve.
Finally, spot and futures are not interchangeable. A headline quoting a commodity price rarely says which month it refers to, so the number alone tells you very little without the curve beside it.
This article is general educational information about market structure. It is not investment advice, and rules and contract specifications vary by exchange and by country.
Frequently Asked Questions
Is contango bullish or bearish?
Neither on its own. Contango describes futures prices sitting above spot, which usually means comfortable supply and high carry costs, while backwardation describes the opposite. Because both are statements about the relationship between months rather than about direction, you can sit in contango while the price rises and in backwardation while it falls. Treat curve shape as a structural read on the physical market, not a directional call.
How are contango and backwardation different in futures trading?
Contango means later delivery months price above earlier ones, so the curve slopes upward and a long position rolling forward buys something more expensive. Backwardation means later months price below earlier ones, so the curve slopes down and each roll adds a small gain. Everything else, from how contracts are priced to how they converge at expiry, works the same in both states.
What happens when a futures contract reaches its delivery date?
The futures price converges toward the spot price at maturity, because otherwise arbitrageurs could lock in the difference. Depending on the contract, delivery is settled physically or in cash. Most participants close or roll their position before that date, which is why the roll, not the delivery itself, drives the return a long investor actually experiences over a full cycle.
Do commodity ETFs rise when spot prices rise?
Often, but not always. A futures-based commodity fund holds contracts, not the physical asset, so its return combines the spot move, the roll yield from the curve shape, and interest earned on collateral. In sustained contango the roll drag can offset a rising spot price over a full year. Funds that hold physical commodity or use a different index construction behave differently, which is why comparing a fund to the spot price can mislead.
Is backwardation always a sign of a commodity shortage?
No. Backwardation shows that buyers are paying a premium for prompt delivery, which can reflect a genuine shortage, a temporary disruption, strong near-term demand, or simply expectations that supply will return soon. Short-lived backwardation often appears in energy markets during weather events or pipeline closures and disappears as soon as the disruption clears, without the shortage ever becoming a structural problem.
Conclusion
Contango and backwardation come down to one question: is a later delivery worth more or less than delivery now? More means contango, built from storage, insurance and financing costs. Less means backwardation, built from scarcity and the premium buyers place on having the physical item immediately.
What to check first is simple. Pull up the contract months for the market you care about, compare the prompt contract against the year-out one, and see which way the line slopes. Then read that shape alongside supply, demand and inventory rather than treating it as a prediction.
Once you know the shape, ask who it suits. Long-only investors care about roll yield, producers benefit from contango storage economics, and hedgers care about which side of the curve their lock-in sits on. Curve shapes change, so treat any read of it as a snapshot dated 2026, never as a standing condition.