The Fed balance sheet tells investors how much liquidity the central bank is adding to, or draining from, the financial system. Its assets, mainly Treasury securities and mortgage-backed securities, sit opposite its liabilities: currency in circulation, bank reserves, the overnight reverse repo facility and the Treasury General Account. The useful signal is the composition of those lines, not the headline total on its own.
Table of Contents
- What Is the Fed Balance Sheet?
- How Should Investors Read the Fed’s Assets and Liabilities?
- What Does a Growing Fed Balance Sheet Signal?
- How Does Quantitative Tightening Affect Investors?
- What Does Bank Reserves Mean for Markets?
- What the Fed Balance Sheet Tells Investors About Liquidity
- How Does It Affect Gold, Silver and Other Commodities?
- What Are the Limits of Reading the Balance Sheet?
- What Should Investors Monitor Alongside the Balance Sheet?
- Frequently Asked Questions
- Does a larger Federal Reserve balance sheet always cause inflation?
- Is quantitative tightening the same as raising interest rates?
- Why are commercial-bank reserves important to the Fed balance sheet?
- Does Fed balance-sheet growth guarantee higher share prices or gold prices?
- How often should investors check the Fed balance sheet?
- Conclusion
What Is the Fed Balance Sheet?
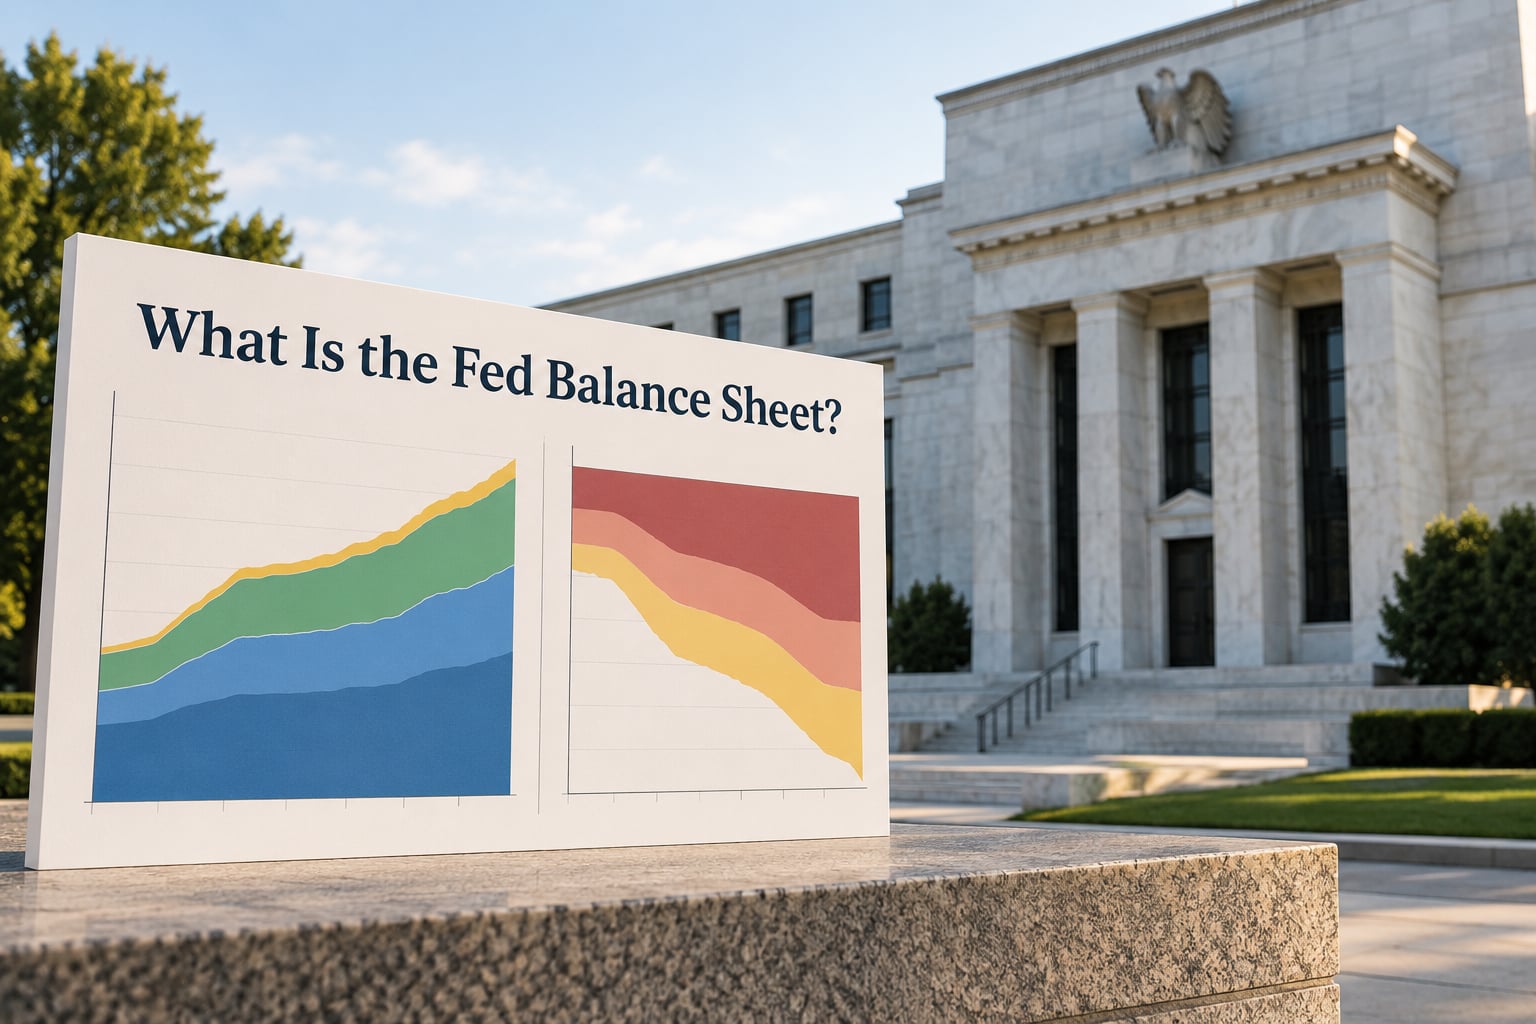
What the Fed balance sheet tells investors is really a liquidity ledger. It is the Federal Reserve’s own accounting statement, published weekly, showing what the central bank owns and what it owes. Like any balance sheet, one side always equals the other: total assets equal total liabilities plus capital.
Two bodies appear in most explanations and it helps to keep them straight. The Federal Reserve Board in Washington sets monetary policy, while the Federal Reserve Bank of New York carries out the trading and accounting behind the open market desk. Most of the balance sheet activity you read about happens in New York, even though the policy decisions come from the Board.
Scale matters more than most people expect. Total assets were about 870 billion dollars in 2006, roughly 6 percent of GDP. After three rounds of quantitative easing they reached roughly 9.0 trillion dollars by April 2022, close to 35 percent of GDP. Whatever the current number reads, the direction since that peak has been contraction.
The statement is published in the H.4.1 release every Thursday, and the headline total assets series is also carried on FRED under the code WALCL, which is what most charts pull from.
One mechanical point that trips people up: the Fed earns interest on the securities it holds and pays interest on the reserves banks hold with it. It runs on the spread, not on profit, and the balance sheet size is a consequence of policy choices plus the private sector’s demand for Fed liabilities.
How Should Investors Read the Fed’s Assets and Liabilities?
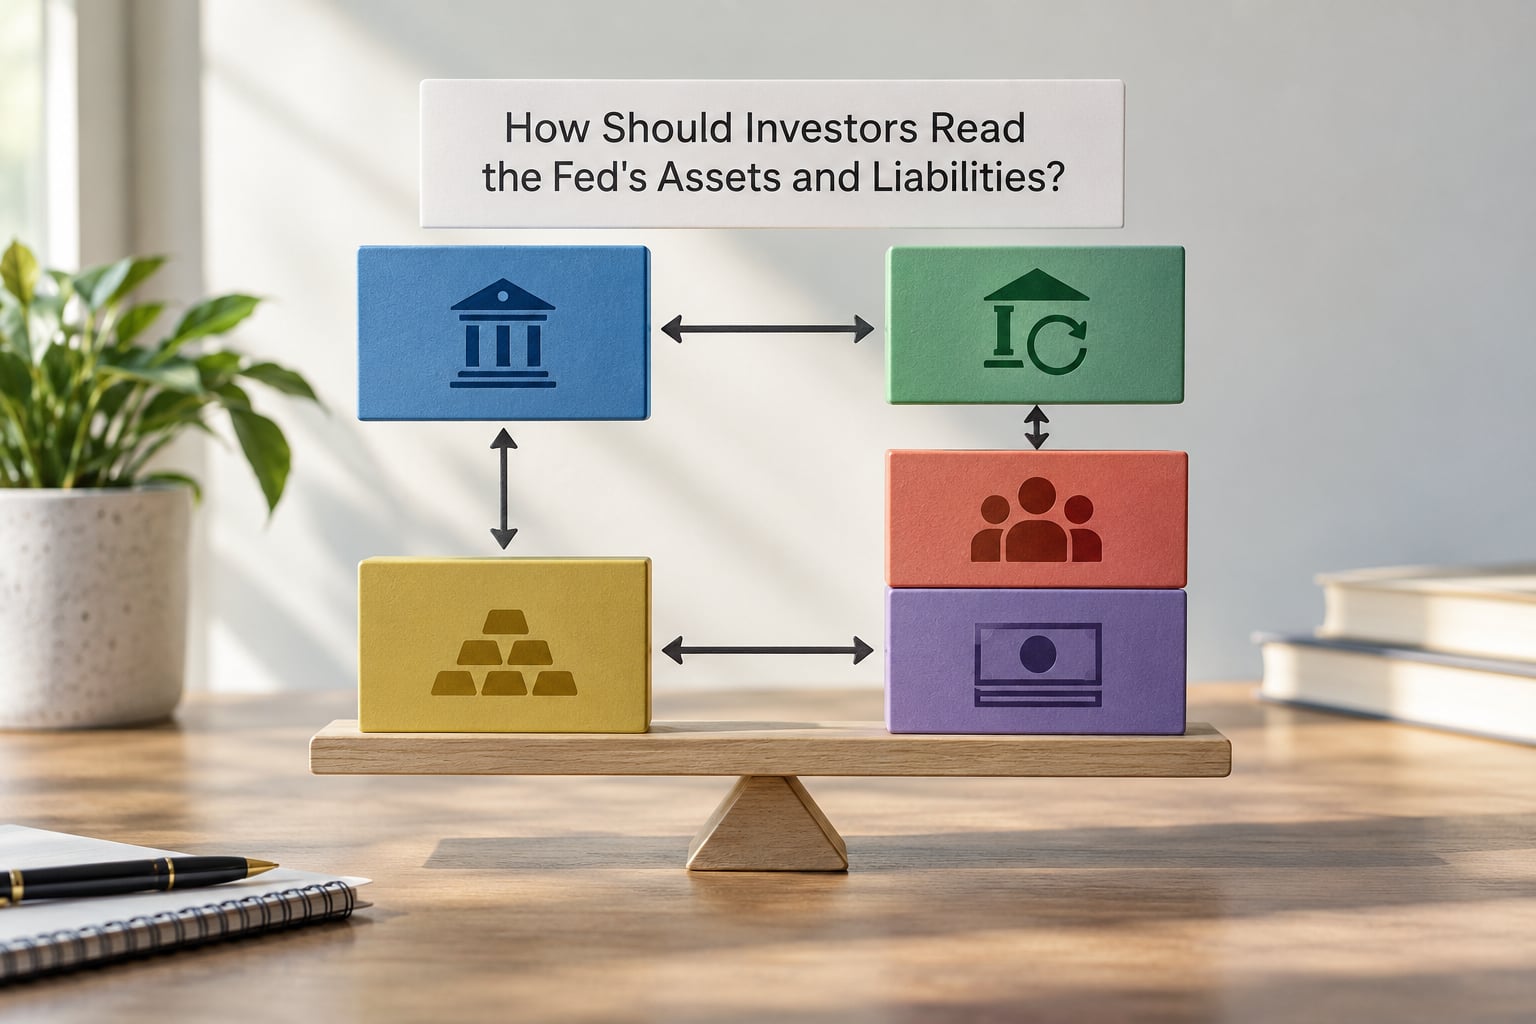
Reading the Fed balance sheet means asking one question about every line: who holds this, and what does a change in it force them to do? The asset side is what the Fed owns. The liability side is what private actors hold, and that is where the investor signal lives, because liabilities are claims the private sector has to fund.
The asset side is dominated by two things. Securities held outright, split between Treasury notes and bonds and agency mortgage-backed securities, make up the bulk of the portfolio. Alongside them sit repo and discount window loans, which are the emergency lending lines, and a much smaller set of foreign currency swaps used in dollar-shortage episodes.
The liability side is more interesting for markets. Reserve balances are what commercial banks hold on deposit at the Fed, and the Fed pays interest on them. Currency in circulation is the paper and coin the public holds. The overnight reverse repurchase agreement facility lets money funds park cash with the Fed for a rate. The Treasury General Account is the government’s checking account, and it is the one line the Fed does not control.
| Balance-sheet line | Side | What it tells investors |
|---|---|---|
| Securities held outright (Treasuries and agency MBS) | Asset | The Fed’s duration exposure. Growth removes duration from private hands; runoff puts it back. |
| Repo, discount window and standing repo loans | Asset | Whether funding markets are under stress. A jump usually means a rate spike or a market seizure. |
| Currency in circulation | Liability | Structural demand for cash, rising in expansions and in periods of stress. Rarely a policy signal. |
| Reserve balances | Liability | The funding cushion for the banking system. Falling reserves matter more than the total once they approach scarcity. |
| Overnight reverse repurchase agreements (ON RRP) | Liability | A buffer that absorbs runoff before reserves are touched. Once it empties, further runoff hits reserves directly. |
| U.S. Treasury General Account | Liability | Government cash sitting at the Fed. A build drains reserves and is a Treasury decision, not policy. |
The row worth watching most closely is the last pair. Money fund balances that leave the ON RRP facility and the Treasury rebuilding its cash account both pull reserves out of the system, which is why a shrinking balance sheet is not the same thing as deliberate tightening.
What Does a Growing Fed Balance Sheet Signal?
When the Fed buys securities, it credits the reserve accounts of the seller’s bank. Assets rise, reserves rise by the same amount, and the operation is repeated across the whole system. That is what quantitative easing is, and it is why balance-sheet growth is read as liquidity support.
QE does a few distinct things at once. It adds reserves, which take pressure off short-term funding rates. It removes duration from private portfolios, which pulls down the term premium and supports longer-dated yields. Buying agency MBS also removes mortgage-backed paper from private hands, which lowers the spread mortgage lenders pay and functions as an implicit subsidy of mortgage lending.
What it does not do is mechanically deliver the asset-price gains that follow it in the headlines. In 2008 and again in 2020, QE arrived alongside a collapsing economy, and it is genuinely disputed among economists whether the purchases caused the recovery or accompanied it. That disagreement is real, and anyone presenting a single clean answer is selling something.
The honest summary is that a growing balance sheet tells you the Fed is defending market functioning and trying to hold short rates down. It does not tell you that rates stay low, that the yield curve steepens on command, or that equities rise from there. Direction of the policy rate still dominates the long end of the curve, and that is set in press conferences, not in the H.4.1.
How Does Quantitative Tightening Affect Investors?
Quantitative tightening is the same plumbing run in reverse, and it is the section where investors get the most hand-waving. When the Fed stops reinvesting maturing Treasuries and lets its portfolio run off, every security that matures is retired and no new one is bought, so reserves decline by the same amount.
| Feature | Quantitative easing | Quantitative tightening |
|---|---|---|
| Policy rate | Usually near the zero lower bound | Can run with rates unchanged |
| Main transmission | Adds reserves and removes duration | Retires securities and drains reserves |
| Typical market read | Support for risk assets and yields | Slow background pressure, often described as paint drying |
| Main risk | Duration taken out of private hands for too long | Reserves becoming scarce faster than banks can adjust |
The practical sequence during runoff is this. ON RRP balances fall first, because that facility absorbs the drain without touching reserves. Treasury issuance and the Treasury General Account absorb more. Only when those buffers are thin does reserve decline begin to bite, which is why a headline like the balance sheet is down by a trillion dollars can mean very little for funding markets.
The September 2019 episode is the standard warning. Reserves had drifted down gradually, then a Treasury settlement drew heavily on the system and overnight repo rates jumped sharply for a day. The Fed responded by stepping in to restore functioning. The lesson for investors is that reserve scarcity announces itself first in funding spreads, well before anything shows up in longer-term asset prices.
As of 2026, the Fed slowed and then halted the runoff phase, and whether it restarts is an active policy debate rather than a settled plan. The arguments for shrinking it are about restoring a scarce-reserves framework and reducing the central bank’s footprint; the arguments against point to the fragility of the money market and Treasury issuance that a large buffer currently absorbs.
Quantitative tightening is not a rate hike. A hike changes the price of money overnight. Runoff changes how much cash sits in the system. The two can point in opposite directions, and markets have been surprised more than once when a balance sheet shrank without any change in the policy rate.
What Does Bank Reserves Mean for Markets?
Reserves are the line item that most often decides whether balance-sheet news matters. They are a liability of the Fed and, at the same time, an asset on the books of the commercial bank that holds them. That double identity is why the phrase reserves are money misleads people: a bank cannot spend a reserve balance directly, it can only hold it at the Fed or lend it out.
Reserves move in and out of the system constantly, mostly through plumbing you never see. A Treasury tax payment moves funds into the Treasury General Account and out of reserve accounts. A bank buys securities and the seller’s bank loses reserves. Nothing here is the Fed creating or destroying money in the way the phrase money printer suggests.
What banks actually want is the ability to settle payments cheaply whenever they need to, and that depends on rules rather than ambition. Liquidity coverage requirements, intraday payment needs, the treatment of reserves under capital rules and the way balances behave under stress all shape how much of a cushion a bank insists on holding. The reserve demand created after the crisis was real, and it is why the balance sheet stayed large long after the run-off officially began.
Two measures help you watch that demand. The reserve-to-deposit ratio compares total reserves with bank deposits and gives a sense of how much cushion sits behind the deposit base. The spread between the secured overnight financing rate and the interest the Fed pays on reserves is the sharper signal, because it prices the marginal cost of holding reserves rather than the average.
What the Fed Balance Sheet Tells Investors About Liquidity
Once you separate the Fed’s actions from the Treasury’s, the weekly numbers become a cleaner liquidity gauge. A common shortcut subtracts the ON RRP facility and the Treasury General Account from total Fed assets to approximate net liquidity available to markets. It is a rough measure and it breaks down during crises, but it does something the headline total cannot: it removes the buffers that absorb runoff passively.
Macro communities such as r/Superstonk track exactly this dashboard weekly, comparing reserve balances, ON RRP usage, the Treasury’s cash account and bank lending side by side rather than reacting to the total. The practical consensus there, which matches how professionals talk about it, is that the reserves line and the composition tell you more than the size.
Interpret it with other data in view. Rates, inflation expectations, the dollar and bank credit all carry independent signal, and a liquidity change only matters when it interacts with one of them. A drain absorbed by a still-full ON RRP facility has almost no market consequence; the same drain when reserves are already lean can move funding costs within hours.
How Does It Affect Gold, Silver and Other Commodities?
Gold and silver respond to the balance sheet indirectly, through channels the Fed does not control. The clearest ones are the dollar and real yields, because a non-yielding metal has no cash flow to discount and competes with dollars as a store of value.
Balance-sheet expansion tends to accompany a period of policy easing, and easing usually pressures the dollar lower while holding real yields down. That combination has historically been supportive for metals, but it is the dollar and the real rate doing the work, not the balance sheet line itself.
That distinction matters for anyone positioning in metals or mining equities. The balance sheet belongs on your weekly list as a backdrop indicator, alongside inflation expectations and the dollar index, rather than as a trigger. Physical demand from central banks has become a separate driver that the balance sheet says almost nothing about, which is another reason to stop treating the two as one trade.
What Are the Limits of Reading the Balance Sheet?
The first limit is that the headline total is an accounting identity, not an economic one. The Fed changed how reserve balances are reported, and composition has shifted repeatedly as tools were introduced and retired. A number that means one thing in one regime can mean something else in the next.
The second is fiscal policy. Treasury issuance and the cash account can add or remove hundreds of billions of dollars of reserves without the Fed doing anything at all, which is exactly the confusion that shows up in forum threads: is this tightening, or is it the Treasury rebuilding cash?
The third is money supply. Balance-sheet growth raises the monetary base, which is the currency plus reserves, and that is not the same as M2. Whether the broader money supply grows depends on bank lending and deposit creation, and how fast money circulates depends on velocity. An expanded base with weak credit demand produced very little inflation after 2009, which is the strongest evidence against the simple money-printing story.
Fourth, expectations are priced. A well-telegraphed runoff tends to have little effect, and asset prices often move ahead of the actual operations. That leaves correlation looking like causation, which is the most common error in commentary on this topic.
What Should Investors Monitor Alongside the Balance Sheet?
Balance sheet data works best as part of a small dashboard. Nine series cover most of what a self-directed investor needs, and all of them are public.
- Total assets (WALCL). Direction and pace, week to week.
- Reserve balances. The cushion; watch for scarcity, not for a big round number.
- ON RRP usage. How much runoff it can still absorb before reserves are touched.
- Treasury General Account. A drain that belongs to the Treasury, not the Fed.
- Reserve-to-deposit ratio. Cushion relative to the deposit base.
- Secured overnight rate versus IORB. The fastest scarcity signal in the money market.
- Bank credit (H.8). Whether banks are turning liquidity into lending.
- Treasury auction sizes and the maturity mix. The other side of the reserve equation.
- Real yields, the dollar and credit spreads. Where the balance-sheet signal meets actual prices.
Thursdays are the day. The H.4.1 lands then, the weekly bank lending data follows separately, and money market spreads are visible every business day. Fifteen minutes after the release is enough to know whether the line that matters moved, and most weeks it will not.
Frequently Asked Questions
Does a larger Federal Reserve balance sheet always cause inflation?
No. Reserve growth raises the monetary base, which is currency plus bank reserves, but inflation depends on credit creation and money velocity too. After 2008 the base expanded for years while broad money growth and lending stayed weak, and prices stayed subdued. Balance sheet size is a backdrop condition, not a trigger.
Is quantitative tightening the same as raising interest rates?
No. A rate hike changes the price of money overnight while the balance sheet size stays as it is. Runoff lets securities mature without reinvestment, shrinking the balance sheet while the policy rate can remain untouched. The two tools can be used together, and markets have been surprised by the gap between them more than once.
Why are commercial-bank reserves important to the Fed balance sheet?
Reserves are how the banking system settles payments, and they are the liability most sensitive to Fed operations. When the ON RRP buffer is full, runoff is absorbed there and reserves barely move. Once it empties, further runoff reaches reserves directly, which is what makes funding spreads the early warning signal during QT.
Does Fed balance-sheet growth guarantee higher share prices or gold prices?
It does not. QE arrived in 2008 and 2020 alongside collapsing economies, and economists still disagree about how much the purchases caused the recovery that followed. Metals respond more directly to the dollar and real yields than to the balance sheet total, so treat size as context rather than as a trade signal.
How often should investors check the Fed balance sheet?
Weekly is enough for most people. The H.4.1 publishes every Thursday, and the lines worth tracking are total assets, reserves, ON RRP usage and the Treasury General Account. Day-to-day balance sheet moves tell you very little. If you trade rates or money market instruments, you will also want the overnight funding spreads, which update every business day.
Conclusion
What the Fed balance sheet tells investors is how much liquidity the central bank is adding or removing, and where that liquidity is sitting. Read the liability side first, because that is where private actors hold claims, and judge the composition rather than the total.
The practical first step is a comparison. Pull the direction and mix of the balance sheet alongside the policy rate path, inflation expectations, the dollar and funding spreads, then ask whether the balance sheet is confirming what those other series are saying. When the lines agree, you have a usable signal. When they disagree, the balance sheet is usually the one that is being misread.