The gold to silver ratio is how many ounces of silver it takes to buy one ounce of gold. You get it by dividing the gold spot price by the silver spot price, so a reading of 80:1 means eighty ounces of silver carry the same market value as one ounce of gold.
That simple quotient hides a lot of argument. It is the most quoted number in precious metals, the most abused one, and the one most often quoted online without a date attached. This guide explains what it measures, how to work it out yourself, why it has ranged from roughly 15:1 to above 120:1 in living memory, and where it stops being useful.
Educational content only, not investment advice. Metals prices move, tax treatment varies by country, and nothing below is a recommendation to buy or sell anything.
Table of Contents
- What Is the Gold to Silver Ratio?
- How to Calculate the Gold to Silver Ratio
- What Does a High or Low Gold to Silver Ratio Mean?
- How Has the Gold to Silver Ratio Changed Historically?
- What Factors Can Move the Gold to Silver Ratio?
- How Do Investors Use the Gold to Silver Ratio?
- What Is the Gold to Silver Ratio Not Telling You?
- How to Track the Ratio for Your Own Research
- Frequently Asked Questions
- What is the historic average gold to silver ratio?
- What is the 80/50 rule for the gold to silver ratio?
- What is the ratio of gold to silver in the earth?
- Is the gold to silver ratio a reliable signal?
- How often should I check the gold to silver ratio chart?
- Why are gold and silver prices so high right now?
- Where to Start With the Ratio
What Is the Gold to Silver Ratio?
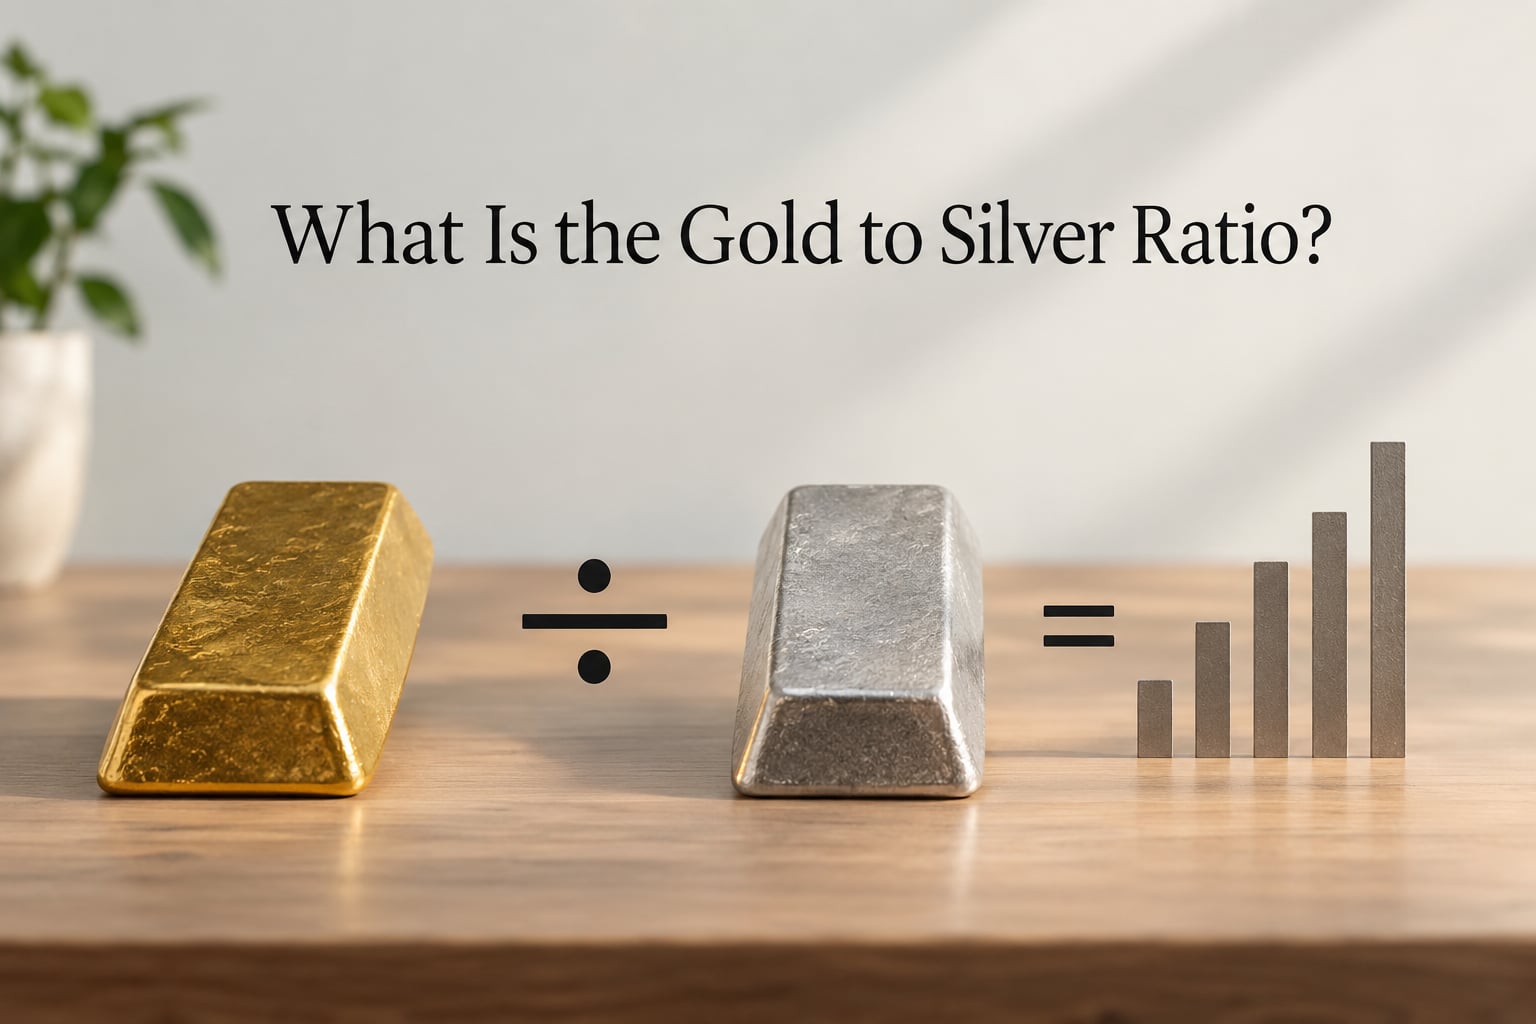
It is a relative price measure between two metals quoted in the same unit, the troy ounce, which is 31.1 grams. Both legs of the division come from the spot price, the price at which the metal trades in the market right now, not the higher ask price a dealer charges you for a coin or a bar.
Read it as an exchange rate rather than a valuation. A currency pair tells you how many pesos one pound buys; the gold to silver ratio tells you how many ounces of silver one ounce of gold buys. When either input moves more than the other, the number changes.
Investors use it to judge which metal looks cheaper relative to the other. When the ratio is wide, silver is inexpensive against gold; when it is narrow, gold is comparatively inexpensive. That is the entire logic behind most of the commentary you will find on the topic.
How to Calculate the Gold to Silver Ratio
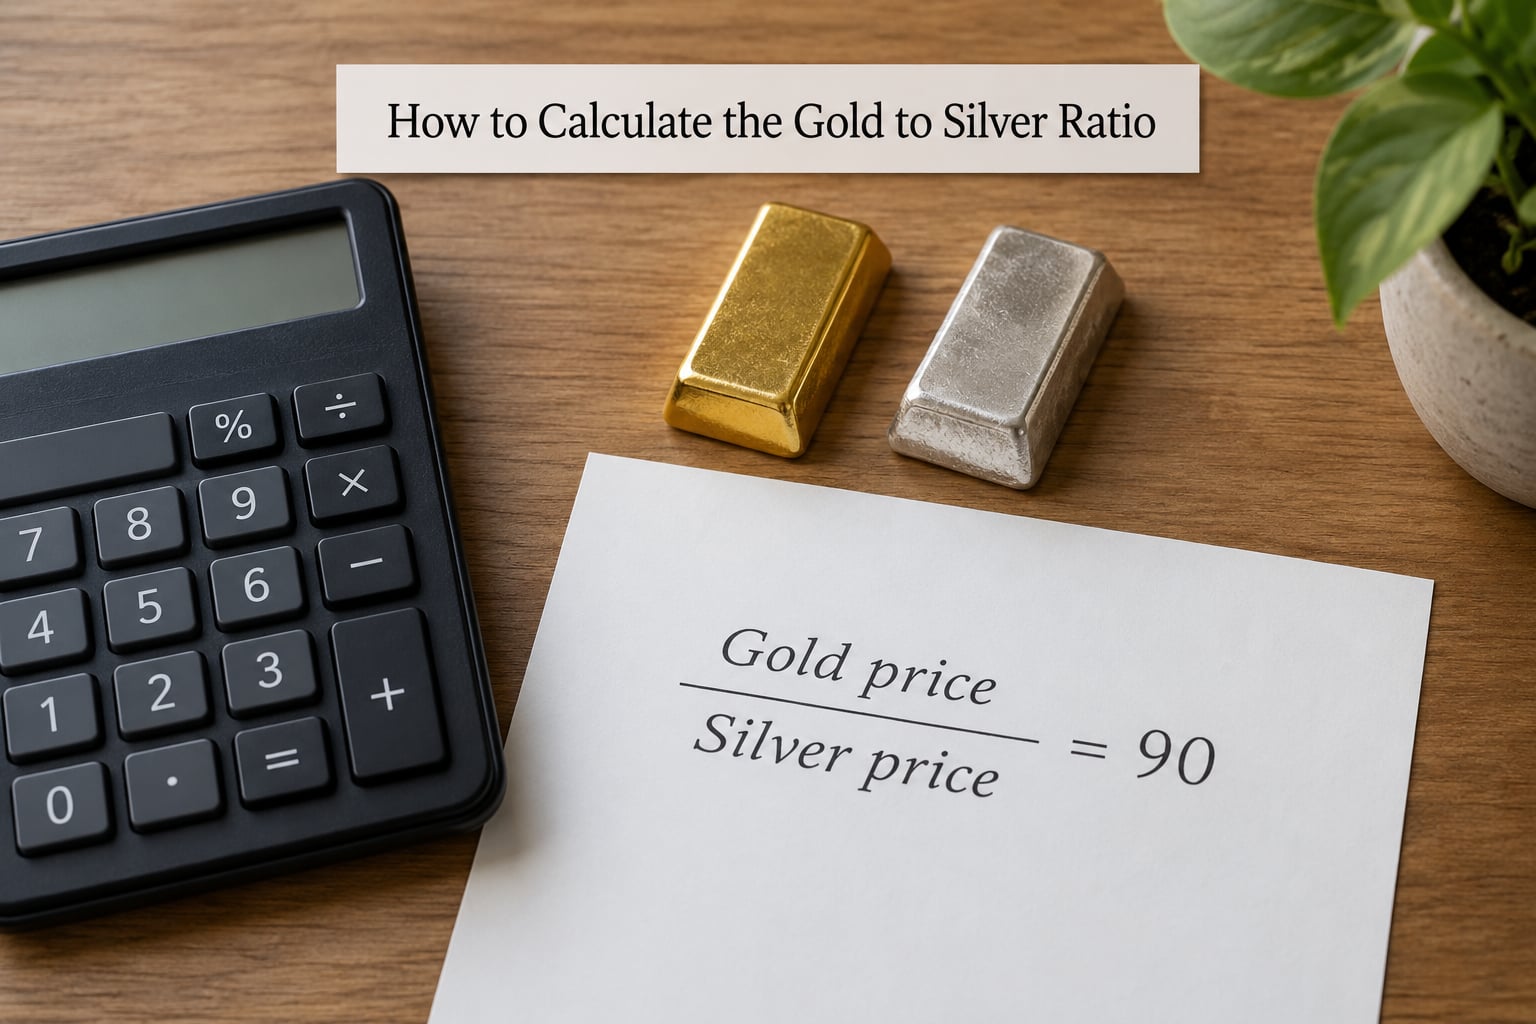
The formula in words:
Gold spot price ÷ Silver spot price = Gold-to-silver ratio
Both prices must be per troy ounce and both must come from the same feed at the same moment. Mixing a London spot quote with a retail ask price produces a number that looks plausible and means very little.
A worked illustration, using round numbers so you can follow the arithmetic. Take gold at 3,350 per troy ounce and silver at 50.00 per troy ounce. Divide 3,350 by 50.00 and you get exactly 67. That is a ratio of 67:1, and it is very close to the level reported in October 2026, when market summaries put the ratio in the upper sixties with no as-of date attached to the figure.
Read the answer as a colon, not a fraction. Writing it as 67:1 means one ounce of gold to sixty-seven ounces of silver, which matches how dealers, chart providers and historians all quote it.
What Does a High or Low Gold to Silver Ratio Mean?
A high reading means gold has outrun silver. Widely cited thresholds treat anything above roughly 80:1 as historically extreme, with the informal 80/50 rule treating 80 and below 50 as the two ends of the range. A narrow reading, near 40:1 or lower, means silver has outperformed gold.
Here is how the commonly cited levels line up with the episodes that produced them.
- Around 120:1 – the panic spike of March 2020, when physical silver buying ran ahead of available supply.
- Above 90:1 – extended stress, typically when gold demand surges and silver is treated as the metal to sell first.
- Above 80:1 – the threshold JM Bullion and other dealers quote as marking silver as undervalued against gold.
- 60:1 to 65:1 – the modern historical average band that BullionByPost supplies in its long-run data.
- 40:1 to 50:1 – a gold-favoured reading, more typical of silver bull phases such as 2011.
- Near 15:1 – the early 1970s trough, the closest silver has come to gold in the modern era.
None of these are trigger points. A rule of thumb like 80/50 is a description of history, not a validated forecast. The ratio spent the whole of the 2010s above its long-run mean, which is exactly why treating the average as a target has frustrated more than one long-term holder.
How Has the Gold to Silver Ratio Changed Historically?
The ratio is only useful if you compare like with like, so the table below mixes two very different kinds of number: statutory and market ratios from the era of bimetallism, then observed market ratios from the twentieth century onward.
| Period | Ratio | Reason |
|---|---|---|
| Ancient Egypt | Roughly 2.5:1 | Gold was rarer and worked more slowly; the electrum alloy sat between the two metals. |
| Roman Empire | Around 12:1 | Silver dominated the coinage of the western empire and served as the working money. |
| Coinage Act of 1792 | Fixed at 15:1 | US law valued silver at fifteen dollars an ounce against gold at fifteen an ounce under bimetallism. |
| 1938 | About 98:1 | The high-water mark for the twentieth century, reached after governments moved off the gold standard. |
| 1960s to early 1970s | Near 15:1 | Silver ran to gold in the run-up to the end of the Bretton Woods era; the closest the two have traded. |
| 1980 | Roughly 40:1 | The Hunt brothers squeeze pushed silver toward gold and briefly frightened physical buyers out of the metal. |
| 2011 | Near 40:1 | Silver’s post-crisis peak relative to gold, the strongest silver has run since the 1980s. |
| 2020 | Above 120:1 | Pandemic panic and retail demand for physical silver drove the all-time high. |
| October 2026 | About 67:1 | Above the 60:1 to 65:1 modern average band, below the 80:1 threshold dealers quote for undervaluation. |
Two things stand out. First, the legal ratio and the market ratio have never agreed: law fixed fifteen ounces of silver to an ounce of gold while the market traded far wider. Second, the modern average is not the ancient average, which is why fifteen-to-one is a historical curiosity rather than a return target.
The monetary backstory is worth a paragraph. Bimetallism tied the currency to both metals until the Coinage Act of 1792 set the statutory fifteen-to-one ratio, the Free Silver Movement fought to expand silver money through the late 1800s, and the gold standard narrowed silver’s monetary role to the twentieth century. Once silver stopped being a money metal, its price came to be set mostly by investment demand and industrial demand.
What Factors Can Move the Gold to Silver Ratio?
Because the ratio is a quotient, it moves when either input moves more than the other. That framing matters, because most readers assume a wide ratio means gold rose. Often the ratio widens because silver fell, which is a different story entirely.
- Safe-haven demand for gold spikes during geopolitical stress and banking stress, and silver rarely rises as fast.
- Industrial demand for silver from solar photovoltaic cells, electronics, electric vehicles and medical applications pulls silver independently of the investment cycle.
- Interest rates and monetary policy affect the opportunity cost of holding a non-yielding metal in both cases, and gold tends to react more sharply.
- The US dollar moves against precious metals broadly; a strong dollar tends to compress both metals’ dollar prices at similar times.
- Inflation expectations tend to support both, but gold has the deeper investor franchise and responds first.
- Investor positioning and futures speculative positioning can swing the smaller silver market more than the larger gold market.
- Supply conditions: annual mine production roughly turns out eight to nine ounces of silver for each ounce of gold, and silver’s smaller market amplifies moves relative to gold.
That last point is why silver is the more volatile of the two. Gold trades in a much larger, deeper market, so the same dollar of demand moves the silver price further, in both directions.
How Do Investors Use the Gold to Silver Ratio?
Mostly as a slow rebalancing trigger rather than a timing tool. Physical stackers check the number periodically, decide whether their silver weighting is unusually high or unusually low relative to gold, and adjust in modest amounts over time.
A typical version of the practice works like this. You set a target allocation, for example holding more gold than silver. When the ratio widens, silver becomes the smaller share of your stack’s value, so you can add silver and spend less per ounce in gold terms. When the ratio narrows, you can rotate some silver into gold. Stackers who post their thresholds publicly tend to pick round numbers: a ratio in the low 80s is historically extreme, the high forties to about sixty is the range where some rotate silver toward gold.
The second use is research hygiene. Dividing both metals by a common measure lets you ask whether the metal you own has become expensive relative to the metal you do not own, which is a cleaner question than asking whether gold is expensive in absolute terms.
What does not work is using the ratio as a switch. The number carries no information about the direction of gold or silver prices from that point onward; it only describes the relationship between them today. Forum posters on r/Silverbugs are blunt about this, describing the ratio as a rebalancing trigger rather than a timing button.
What Is the Gold to Silver Ratio Not Telling You?
It is silent on almost everything that decides whether you make money, which is why it attracts so much overreach. Here is what it cannot do.
- It cannot predict returns. A wide ratio has coexisted with silver falling for years; a narrow ratio has preceded sharp reversals.
- It does not say which metal is absolutely cheap, only which is cheaper relative to the other.
- It depends on your data feed and your moment. Spot and futures prices, different providers and different hours can put readings tens of points apart.
- It ignores everything after the spot price: dealer premiums, bid and ask spreads, storage, insurance and taxes.
- It carries no information about silver’s industrial future, which is the strongest argument that the modern average may never return.
That last point deserves more than a line, because it is the strongest argument against the mean-reversion thesis. Geologically, silver is far more common than gold: roughly one gram of silver per 12.5 metric tons of crust against roughly one gram of gold per 250 metric tons, figures Royal Mint attributes to Goldcorp. Forum arguments take that further, citing seven times more silver than gold and pricing it near twenty to one. Annual mine production supports a similar figure at roughly eight to nine ounces of silver per ounce of gold.
So there are three competing fair-value anchors, and they disagree: crustal abundance around seven to nineteen to one, the mining ratio at eight to nine to one, and the observed market average at sixty to sixty-five to one. Geology sets how much metal exists; production sets how fast it arrives; markets price what buyers will pay today. Nothing in the ratio itself resolves that disagreement, and scarcity does not mechanically set price.
The counter-case to mean reversion is straightforward. Silver’s industrial half of demand did not exist at historical scale when the old averages were recorded, so a buyer in 2026 is looking at a different metal from the one behind the historic average. Repricing can be permanent, not a delay.
How to Track the Ratio for Your Own Research
The process is short, and most of it is about discipline rather than data collection.
- Pick two spot price sources, one for gold and one for silver, and use the same pair every time you calculate.
- Use per-troy-ounce spot quotes, never dealer ask prices or retail coin prices.
- Divide gold by silver and write the result down with the date and the two input prices beside it.
- Compare that reading against a defined historical band, such as the 60:1 to 65:1 modern average, rather than against a price target.
- Note what changed in the drivers listed earlier, since a ratio move caused by silver selling off is not the same setup as one caused by gold selling off.
- Revisit on a schedule, monthly or quarterly for most stacks, rather than daily.
The last two points are where readers get hurt. Figures quoted on forums and dealer pages routinely carry no as-of date, and commenters will cite the ratio as 58, 67, 85 or 90 at different moments without qualification. A number you cannot reproduce from two inputs you can see is not a fact, it is a rumour.
Frequently Asked Questions
What is the historic average gold to silver ratio?
The modern historical average sits in a band of roughly 60:1 to 65:1, the range long-run data providers use when describing recent decades. Earlier eras are not comparable: US law fixed the ratio at 15:1 under the Coinage Act of 1792, and it reached about 98:1 in 1938 and above 120:1 in 2020. Compare like with like before using any average.
What is the 80/50 rule for the gold to silver ratio?
It is an informal rule of thumb rather than a validated signal. The idea is that a ratio above 80 marks silver as historically undervalued against gold, while a reading below 50 suggests the opposite. The trouble is duration: the ratio has spent long stretches above its long-run mean, so reaching 80 says nothing reliable about what the ratio does next.
What is the ratio of gold to silver in the earth?
The commonly cited figures are about one gram of silver per 12.5 metric tons of crust and one gram of gold per 250 metric tons, which Royal Mint attributes to Goldcorp. That implies roughly twenty ounces of silver for each ounce of gold. Forum posters cite seven to nineteen times, and mine production yields roughly eight to nine to one. Abundance sets availability, not price.
Is the gold to silver ratio a reliable signal?
No. It is a relative-value context tool, not a prediction signal. It tells you which of two metals is cheaper against the other, not where either price goes next. It also depends on your data feed, the moment you checked, and whether you used spot or futures prices. It works best as one input among many, alongside the drivers behind each metal’s own price.
How often should I check the gold to silver ratio chart?
Periodically rather than daily. For most long-term holders a monthly or quarterly check is enough, because the ratio is used to guide gradual rebalancing, not to time entries. Watch out for quoted figures without an as-of date; online readings can differ by tens of points between providers and hours, so record the date and both input prices whenever you calculate it yourself.
Why are gold and silver prices so high right now?
That question asks about absolute prices rather than the ratio, which only describes gold relative to silver. Higher prices usually reflect safe-haven demand for gold during uncertainty, inflation expectations, monetary policy and dollar moves, plus industrial demand for silver from solar, electronics, vehicles and medical uses. Note also that dealer ask prices sit above spot and include premiums, spread and storage.
Where to Start With the Ratio
Start by refusing the free figures online until you can reproduce them. Pick two spot prices from one provider, divide one by the other, and write the date next to it. Once you have your own number, treat anything above the 60:1 to 65:1 modern average band as a prompt to think about your relative weighting, not as a buy instruction.
Keep the three fair-value anchors in view together: crustal abundance, the mining ratio and the observed market average. They disagree, and the disagreement is the honest answer to why the gold to silver ratio is where it is today.