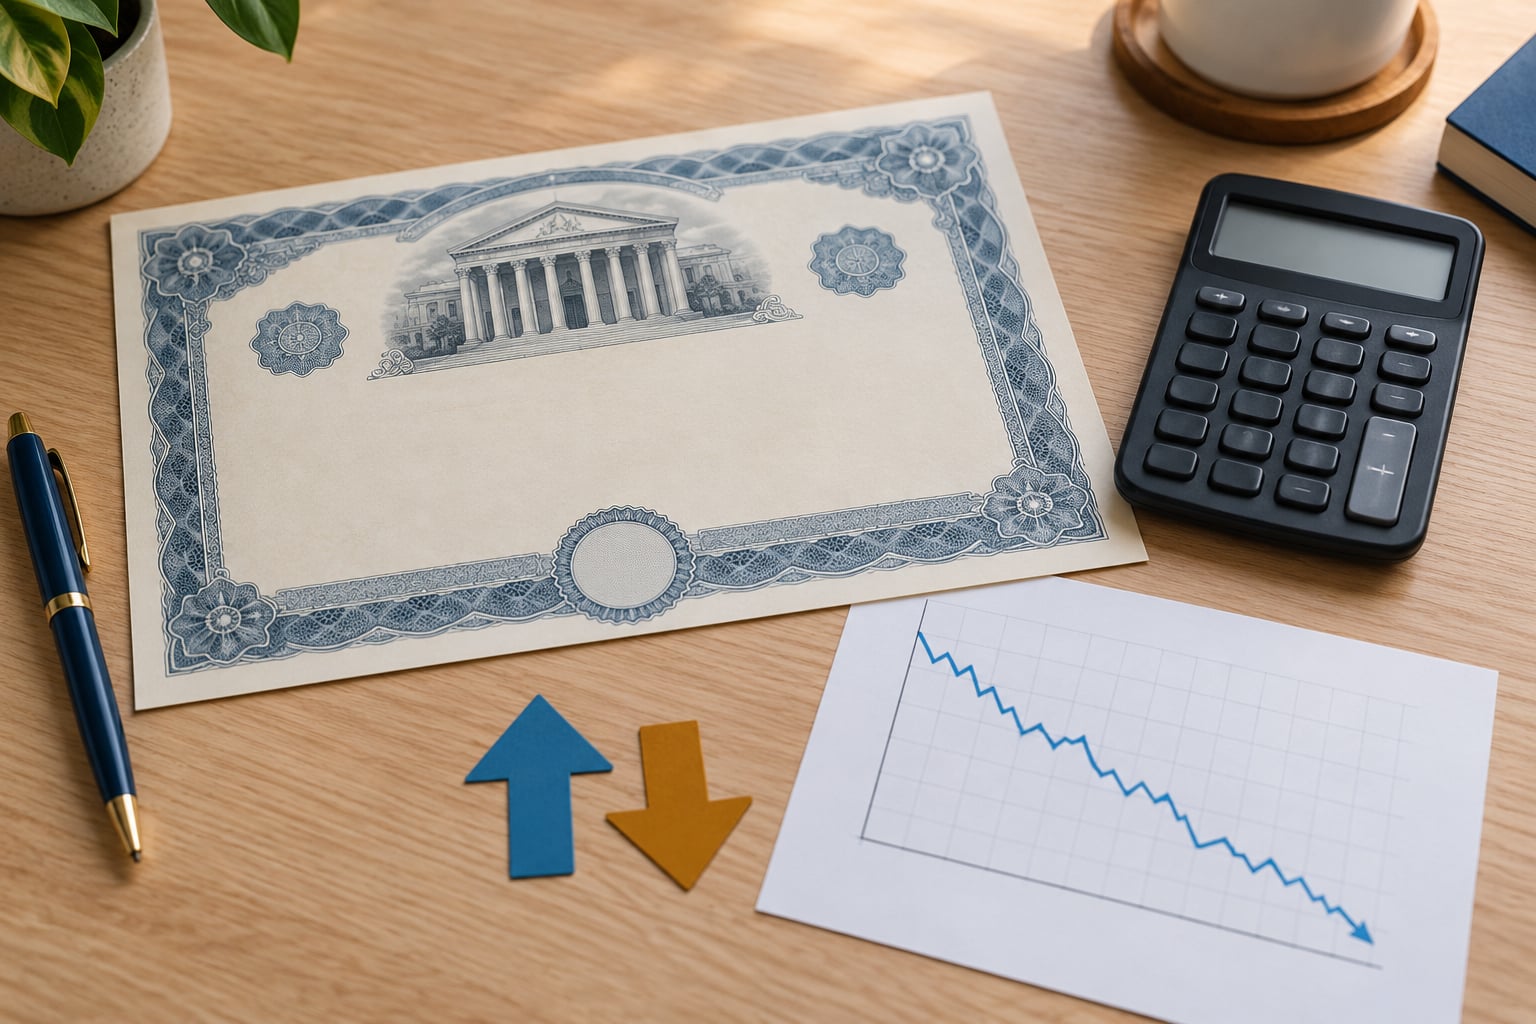
The short answer to how bond yields and prices move: the two run in opposite directions. When market yields rise, the price of an existing bond falls; when yields fall, the price climbs. The mechanism is simple — the coupon payments on a bond are fixed until maturity, so the only lever a buyer has left is the amount they pay for that fixed stream of cash.
That one mechanic explains why a bond fund can be down several percent in a month when nothing about the underlying loans changed. It also explains why investors keep watching rate announcements even though their bond might not mature for fifteen years. Everything below builds from that starting point, with plain numbers rather than formulas pulled out of nowhere.
One note before we start: rates, tax treatment and market rules differ by country and change over time. This is a mechanics guide, not personal investment advice.
Table of Contents
- How Bond Yields and Prices Move in Opposite Directions
- How Bond Yields and Prices Move Together
- Why Bond Prices Fall When Yields Rise
- How long maturity changes the reaction
- What Causes Bond Yields to Change
- How to Read the Yield Curve
- Upward sloping curve
- Inverted curve
- Flat curve
- How to Calculate a Simple Bond Price Change
- What This Means for Bonds, Stocks, and Savings
- Individual bonds and bond funds behave differently
- Reinvestment risk is the quiet one
- Callable bonds behave differently in both directions
- Frequently Asked Questions
- Why do bond prices and yields move in opposite directions?
- Is yield the same thing as the interest rate on a bond?
- Do longer-term bonds always have higher yields?
- What happens to an existing bond when market yields rise?
- How do bond funds react when interest rates change?
- Does a falling yield always mean a bond is a good investment?
- Conclusion
How Bond Yields and Prices Move in Opposite Directions
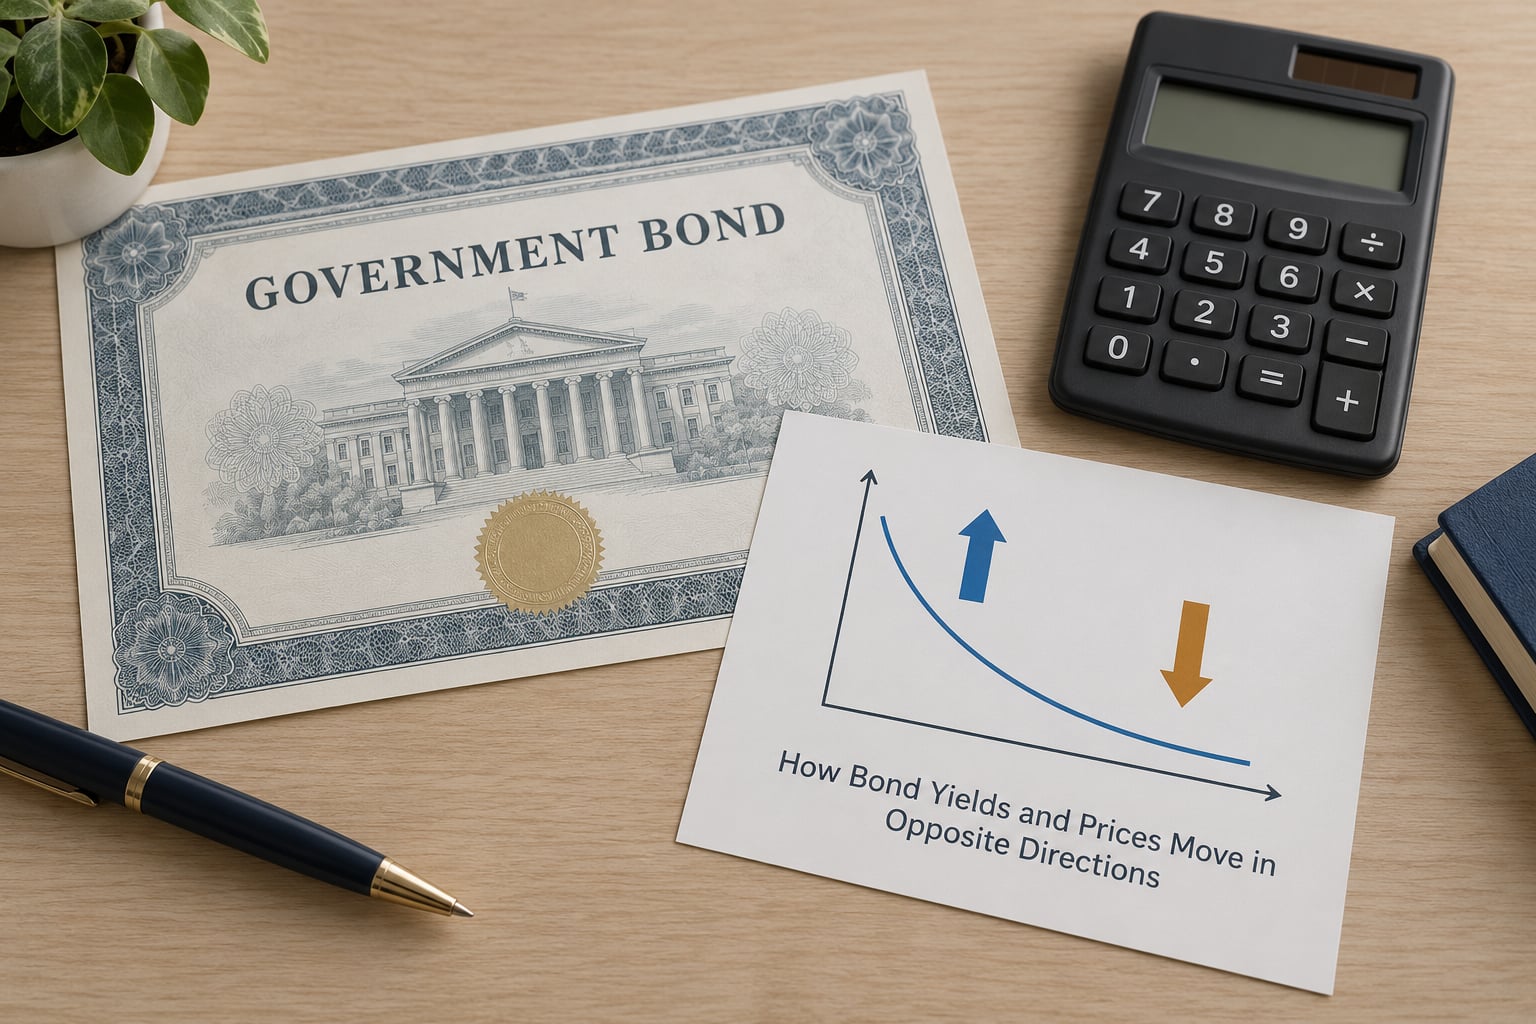
The direct answer: bond prices and yields are two ways of quoting the same deal. A bond pays you a fixed coupon every year and returns face value at maturity. If you pay more than those payments justify, your return drops below the coupon rate. If you pay less, your return rises above it.
Think of a newly issued 5% coupon bond with a face value of 100. It sells at 100 and everyone who buys it earns 5% a year. Now the central bank raises short-term rates and new bonds are issued paying 6%. The old 5% bond still promises exactly 5% — nothing about it improved — so a new buyer will only pay less than 100 to hold it, and the market price drops accordingly.
Run that logic backwards and you get the same result with the sign flipped. If new bonds are being issued at 4%, the 5% bond is more attractive than the alternatives, buyers push its price above face value, and its yield settles below 5% even though the coupon never changed.
So the same three numbers always move in this pattern: the coupon is fixed, the price floats, and the yield is whatever the fixed coupon works out to at the price being asked today. When prices are quoted as a percentage of face value, a bond below 100 is called a discount bond and one above 100 is a premium bond.
How Bond Yields and Prices Move Together
Several terms get mixed up here, and most of the confusion in the comments sections of finance forums comes from treating them as the same thing. They aren’t. Each one answers a different question about the same bond.
| Term | What it tells you | Example: 5% coupon, 10 years left, priced at 95 |
|---|---|---|
| Face (par) value | The amount repaid at maturity, fixed when issued | 100 |
| Coupon rate | The fixed annual interest, as a share of face value | 5% of 100 = 5 per year |
| Market price | What a buyer pays in the secondary market today | 95 |
| Current yield | Annual coupon divided by today’s price | 5 divided by 95 = 5.26% |
| Yield to maturity | The annualised return if held to maturity, assuming every coupon is reinvested | Roughly 5.7% |
Maturity matters too, and not just because of the repayment date. The longer the remaining term, the more of your return sits in future payments that have to be discounted at today’s rates, which makes long bonds twitchier than short ones.
Current yield is the figure many news summaries quote because it’s easy, but it ignores reinvestment. Yield to maturity is the fuller number, and it’s the one to compare across bonds with different coupons and maturities. It assumes you reinvest every coupon at the same yield, which is an assumption, not a promise.
Why Bond Prices Fall When Yields Rise
Here’s the arithmetic behind it. Take that 5% coupon bond, ten years to maturity, face value 100. Cash out: ten coupons of 5, plus 100 at the end. Discount every one of those payments at the rate a buyer can get today and you arrive at a price.
At a 5% discount rate, the price is 100. At 6%, the same bond is worth roughly 92.5. At 4%, roughly 108. Nothing about the issuer’s promise changed. What changed is the rate used to shrink future dollars down to today’s money, and that single input swings the price by double digits.
Duration is the number that captures this sensitivity in one figure. It’s often expressed in years and it’s the practical answer to the question “how much will this bond move if rates move?” Multiply modified duration by the change in yields to get an approximate percentage price move.
A bond with a modified duration of 7 would fall roughly 3.5% if yields rose 50 basis points, or rise roughly 3.5% if yields fell that far. Shorter bonds have smaller duration numbers, so they move less. Long bonds carry much larger ones, which is why a two-year note barely registers on a rate move while a thirty-year bond can swing several percent.
Convexity is the correction term most explanations skip. Because a bond’s price-yield relationship curves rather than runs straight, the same rate move produces a slightly larger gain than loss depending on direction. Duration gets you close; convexity explains why your estimate is never quite exact.
How long maturity changes the reaction
A one-year bond barely changes when rates shift, because almost all its value is sitting in payments that arrive within months. A twenty-year bond holds far more of its value out in the distant future, where discounting has a much bigger effect. Duration measures exactly this distance in time, and it is the number to check before you buy anything with a long term.
What Causes Bond Yields to Change
Rates don’t move because of bond sentiment. They move because of a handful of underlying forces, and once you know which one is in play you can usually guess how existing bonds will respond.
- Central bank policy. When a central bank raises its policy rate, short-term borrowing costs more, and rates across the curve usually adjust upward with it. Cuts push the other way.
- Inflation expectations. Investors demand compensation for expected inflation. When expected inflation rises, nominal yields tend to rise too, which pushes fixed coupon payments down in present value terms.
- Economic growth. Stronger growth typically means higher future rates and a steeper curve, since investors want more return for locking money up. Weak growth pulls expected short rates down.
- Government supply and demand. Heavy issuing by a sovereign, or a weak run of auctions, can push its yields up at the margin even when policy is unchanged.
- Credit risk. For corporate and municipal issuers, a downgrade widens the spread over the risk-free rate. Prices fall even if base rates do not move, because the promised cash flows became less certain.
- Liquidity and technicals. Fund outflows, dealer balance sheet limits and heavy issuance in the primary market all move prices around without any change in fundamentals.
The split worth remembering: government bond yields are driven mainly by policy, inflation expectations and growth, while corporate bond yields move with those same forces plus a credit spread on top. That spread is why a company’s bonds can fall on an earnings downgrade even in a week when rates are flat.
How to Read the Yield Curve
The yield curve is simply the spread between short-term and long-term yields for the same borrower, plotted out across maturities. Its shape is a snapshot of what markets currently expect, not a promise.
Upward sloping curve
Long yields sit above short yields. This is the normal shape, reflecting the expectation that rates will drift up over time plus a term premium for locking money away. Borrowers lock in long rates; savers get paid to wait.
Inverted curve
Short yields exceed long yields, meaning markets are pricing near-term rates above longer-term ones. That usually happens when a central bank has raised short rates well above the rest of the curve while growth expectations weaken. An inversion is widely watched because it has preceded several recessions historically. It’s a signal about risk, not a trigger for a specific trade.
Flat curve
Short and long yields sit close together, usually when policy has moved a lot and the market is uncertain which way rates settle next. Ladders built across maturities are cheapest to construct while a curve is steep, since each rung is priced above the short end.
Read a curve as a description of rates today and expectations embedded in them, not a forecast that must come true. If expectations are wrong, the curve re-steepens or re-flattens, which moves long bonds again regardless of what the central bank does.
How to Calculate a Simple Bond Price Change
You do not need a pricing terminal for a rough estimate. Three numbers are enough: modified duration, the yield change in basis points, and the direction.
The approximation is: percentage price change ≈ minus modified duration × yield change. One basis point is 0.01%, so a move from 4.00% to 4.50% is 50 basis points, written as 0.005 in decimal form.
Work it through with the bond fund rather than a single bond. Take a fund with a modified duration of 7. If yields rise 50 basis points, the estimate is a loss of roughly 3.5%. If yields fall 50 basis points, the estimate is a gain of roughly 3.5%. Direction matters because convexity is not symmetric, but the sign and rough size are what you need for a sanity check.
Keep the estimate honest by remembering what it leaves out. Convexity adjusts the number slightly, credit spreads can move independently of base rates, and any fund with credit or high-yield holdings will behave differently from a pure Treasury fund of the same duration. The calculation tells you the order of magnitude, not the exact closing price.
What This Means for Bonds, Stocks, and Savings
For someone holding a bond to maturity, a price drop caused by rates is mostly a paper loss. If you keep collecting coupons and the issuer pays, you receive what you bought. The pain shows up if you need to sell before maturity, or if you spent the money on a date you can’t move.
For someone buying new bonds, higher yields are a better entry on future income. That’s the offsetting half of the same fact that makes existing holdings look bad.
Individual bonds and bond funds behave differently
A single bond held to maturity follows a predictable path as long as the issuer pays. A bond ETF never matures. It holds whatever is inside it on each rebalancing day, so its yield, duration and credit profile drift over time, and its price tracks the market continuously. Some of that is a genuine advantage in a rising-rate environment, because new bonds entering the fund carry higher coupons, and it can shorten duration automatically. The trade-off is that a maturing bond must be replaced, and reinvestment happens at whatever yields exist then.
Fund fact sheets list effective duration, 30-day SEC yield and distribution yield. The distribution yield simply counts the last month’s payouts and can be higher or lower than the SEC yield, which estimates what the fund is currently earning after expenses. Reading both avoids mistaking a passing cash flow for a return.
Reinvestment risk is the quiet one
When a 4% bond matures in a 2% world, the cash gets reinvested at 2% and the income drops. Rising yields help new buyers and hurt the reinvestment outlook for someone whose high-coupon bonds are maturing. That’s why a barbell or ladder strategy, which staggers maturities, is popular with income investors: it turns one reinvestment decision into many smaller ones spread over time.
Callable bonds behave differently in both directions
An issuer can pay a premium to retire a bond early, usually when rates have fallen enough to refinance cheaply. When that happens, the holder’s outstanding bond stops earning the higher coupon. Rising rates are painful for the borrower; falling rates are painful for the holder, which is why a callable bond’s price gains flatten as rates drop.
On the equity side, bond yields feed stock valuations through discount rates. Higher long yields raise the bar for what future cash flows are worth today, and growth shares tend to feel that more than value shares. Cash and money market accounts reprice quickly in both directions, so they stay competitive when yields fall but give up purchasing power when yields rise and inflation holds.
Anyone building a portfolio or choosing a retirement income product should treat rates as one input among several — alongside time horizon, tax treatment and the issuer’s credit quality — rather than as a signal on its own.
Frequently Asked Questions
Why do bond prices and yields move in opposite directions?
A bond pays fixed coupon amounts and returns face value at maturity. Those payments never change, so the price adjusts to whatever buyers will pay. Paying more than the coupons justify lowers the return, so the yield falls; paying less raises it. Same bond, same cash flows, opposite readings of the price.
Is yield the same thing as the interest rate on a bond?
No. The coupon rate is the fixed interest the issuer promises, set when the bond is issued. Yield is what you actually earn based on the price you paid. Buy at face value and current yield equals coupon rate; buy below face value and the yield on your money is higher, while the coupon payment stays the same.
Do longer-term bonds always have higher yields?
Usually, but not always. A steep upward curve is the normal shape because of expected future rates and the term premium for locking money up. Sometimes investors expect rates to fall, and long yields come in below short yields. That inversion is a signal about expectations, and it does not guarantee long bonds will outperform from there.
What happens to an existing bond when market yields rise?
Its market price falls, because every remaining coupon and the maturity repayment get discounted at a higher rate. Longer bonds fall more, which is what duration measures. If you hold to maturity and the issuer pays, you still receive the coupons and face value you were promised, so the drop is a paper loss unless you sell early.
How do bond funds react when interest rates change?
Like a portfolio of the bonds they hold. When yields rise, fund prices fall roughly in line with the fund’s effective duration, and the reverse holds when yields fall. A fund never matures, so as older bonds pay out, the money gets reinvested at whatever rates exist then. That rolling reinvestment is the main difference from holding one bond to maturity.
Does a falling yield always mean a bond is a good investment?
No. A falling yield usually means existing bond prices have already risen, which means less income for a new buyer. You may be locking in a lower return on money you plan to deploy later. Judge a bond on its yield relative to inflation, tax treatment, credit quality and how long you need the cash, not on whether yields happen to be falling.
Conclusion
Bond prices and yields describe the same transaction from opposite sides, and the fixed nature of the coupon is what forces the link. Rates move, prices adjust in the opposite direction, and duration tells you by how much.
Start with any bond on your screen and pull up five numbers: face value, coupon rate, maturity date, current yield and yield to maturity, plus the duration if it’s a fund. Once those are in view, a rate headline stops being noise. You can estimate the impact yourself with a short multiplication, and you’ll know whether the holding suits the time horizon you actually have.