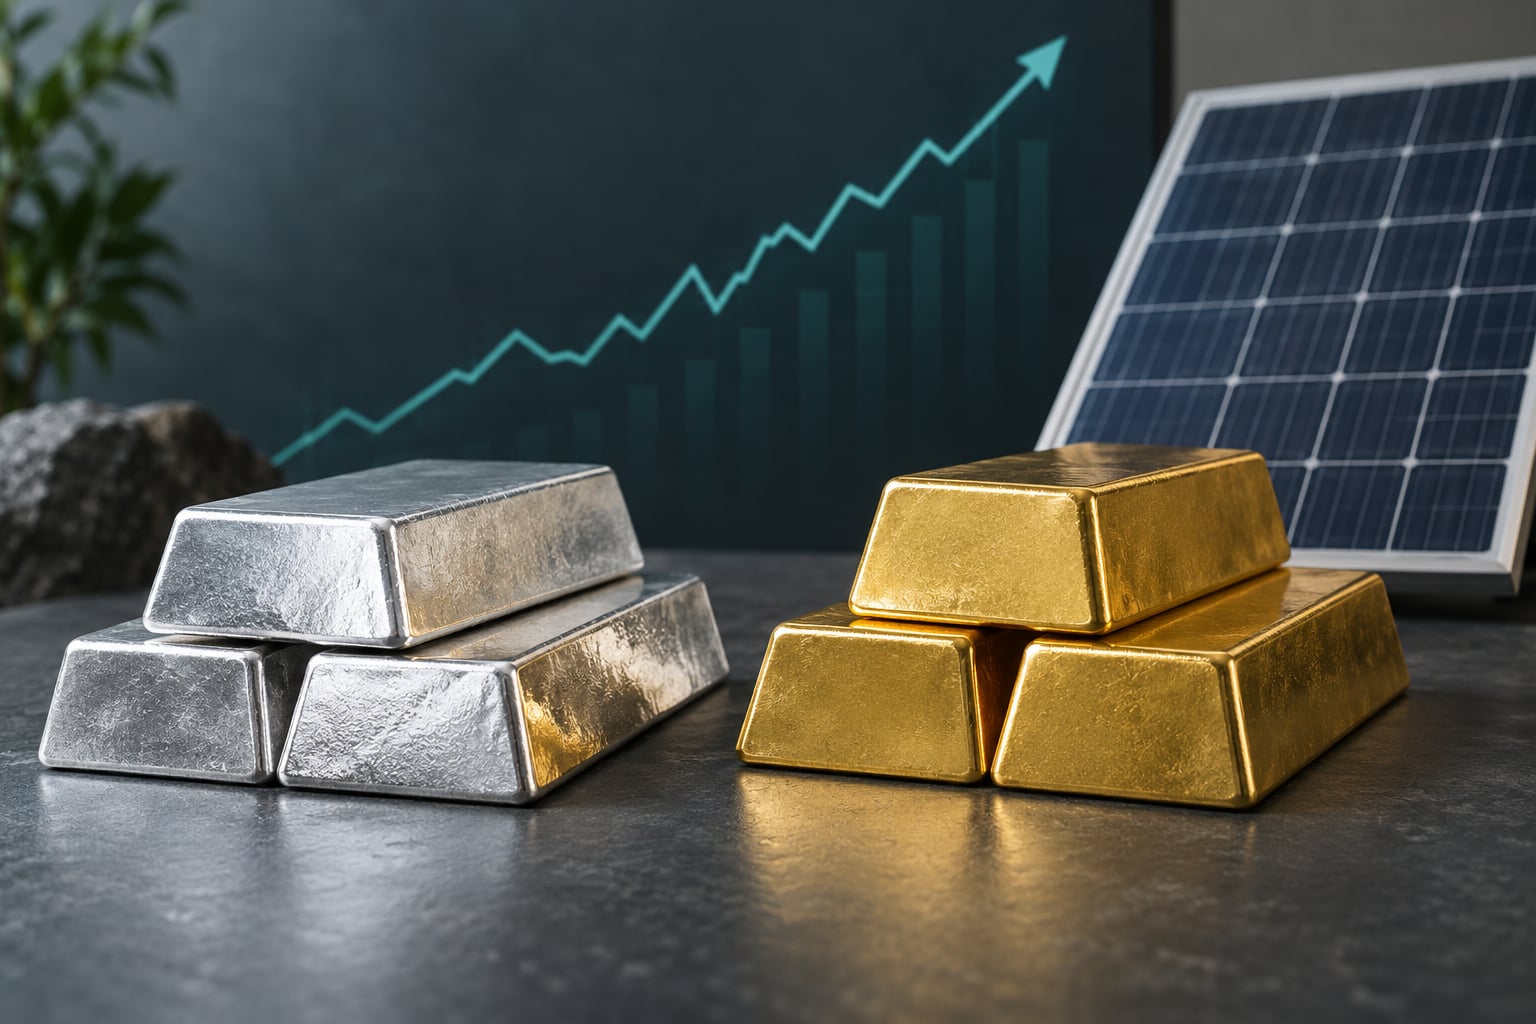
Silver outruns gold in many precious-metals bull markets for five linked reasons: a large industrial demand base, a much smaller and thinner market, mine supply that cannot respond quickly to higher prices, a higher beta to gold, and momentum amplifiers that kick in once a trend breaks. Outperformance is a percentage return over a set period, not a permanent rule — silver usually lags when gold rallies on fear.
- Higher beta — silver’s smaller, less liquid market amplifies both directions when metals sentiment improves.
- Industrial demand — solar, electronics, electric vehicles and grid buildout create a bid that gold, a monetary metal, does not have.
- A tighter market — modest investor flows move silver’s price further than they move gold’s.
- Slow supply response — most silver arrives as a by-product of mining lead, zinc, copper and gold, so output barely reacts to the silver price.
- Momentum and short covering — once a breakout takes hold, trend-following money and futures shorts forced to buy back can extend it fast.
The rest of this guide takes each driver apart, then spends real space on the conditions where the logic breaks down. That second half matters, because the bull case for silver is the most heavily promoted story in the metals world right now, and the record of ratio forecasts made over the past five years is not flattering to anyone making them.
Table of Contents
- Why Does Silver Sometimes Outperform Gold?
- Silver vs. Gold at a Glance
- 5 Drivers of Silver’s Outperformance in Bull Markets
- 1. Silver Has Higher Market Beta
- 2. Silver’s Industrial Demand Adds an Engine
- 3. A Smaller Market Creates a Tighter Price Response
- 4. Supply Can Be Slower to Respond
- 5. Bull Markets Can Trigger Momentum and Short Covering
- What Economic Conditions Favor Silver Over Gold?
- Why Silver Does Not Always Outperform Gold
- How Investors Can Measure the Silver-to-Gold Ratio
- Key Factors to Monitor Before Acting
- Frequently Asked Questions
- Does silver outperform gold in every bull market?
- What makes silver rise more than gold during a precious-metals rally?
- Is silver more volatile than gold, and why does that matter?
- Does the gold-to-silver ratio predict when silver will outperform?
- Which economic indicators are most useful for comparing silver and gold?
- Conclusion
Why Does Silver Sometimes Outperform Gold?
Silver can rise faster than gold because its market is smaller, its supply is less responsive, and it carries an industrial demand engine that gold does not. When investor appetite for precious metals accelerates, that combination lets a given change in flows produce a much bigger percentage move in silver than in gold.
Outperformance means one thing precisely: silver returned a higher percentage gain than gold over a stated interval. It does not mean silver trades above gold in price — it never does — and it does not mean silver wins in every metals rally. In a rally driven by recession fear or a flight to safety, gold is usually the metal that leads.
So when people ask why silver outperforms gold in bull markets, they are usually describing a specific phase: growth expectations improving, real yields falling, the dollar softening, and manufacturing data turning up at the same time. That combination is the whole story. Take any one piece away and the outperformance usually shrinks or disappears.
What follows is a cyclical argument, not a structural one. Silver has lagged gold badly for long stretches — the entire 1980s and 1990s, most of it. Anyone framing silver as a permanent winner is describing a cycle and calling it a destiny.
Silver vs. Gold at a Glance
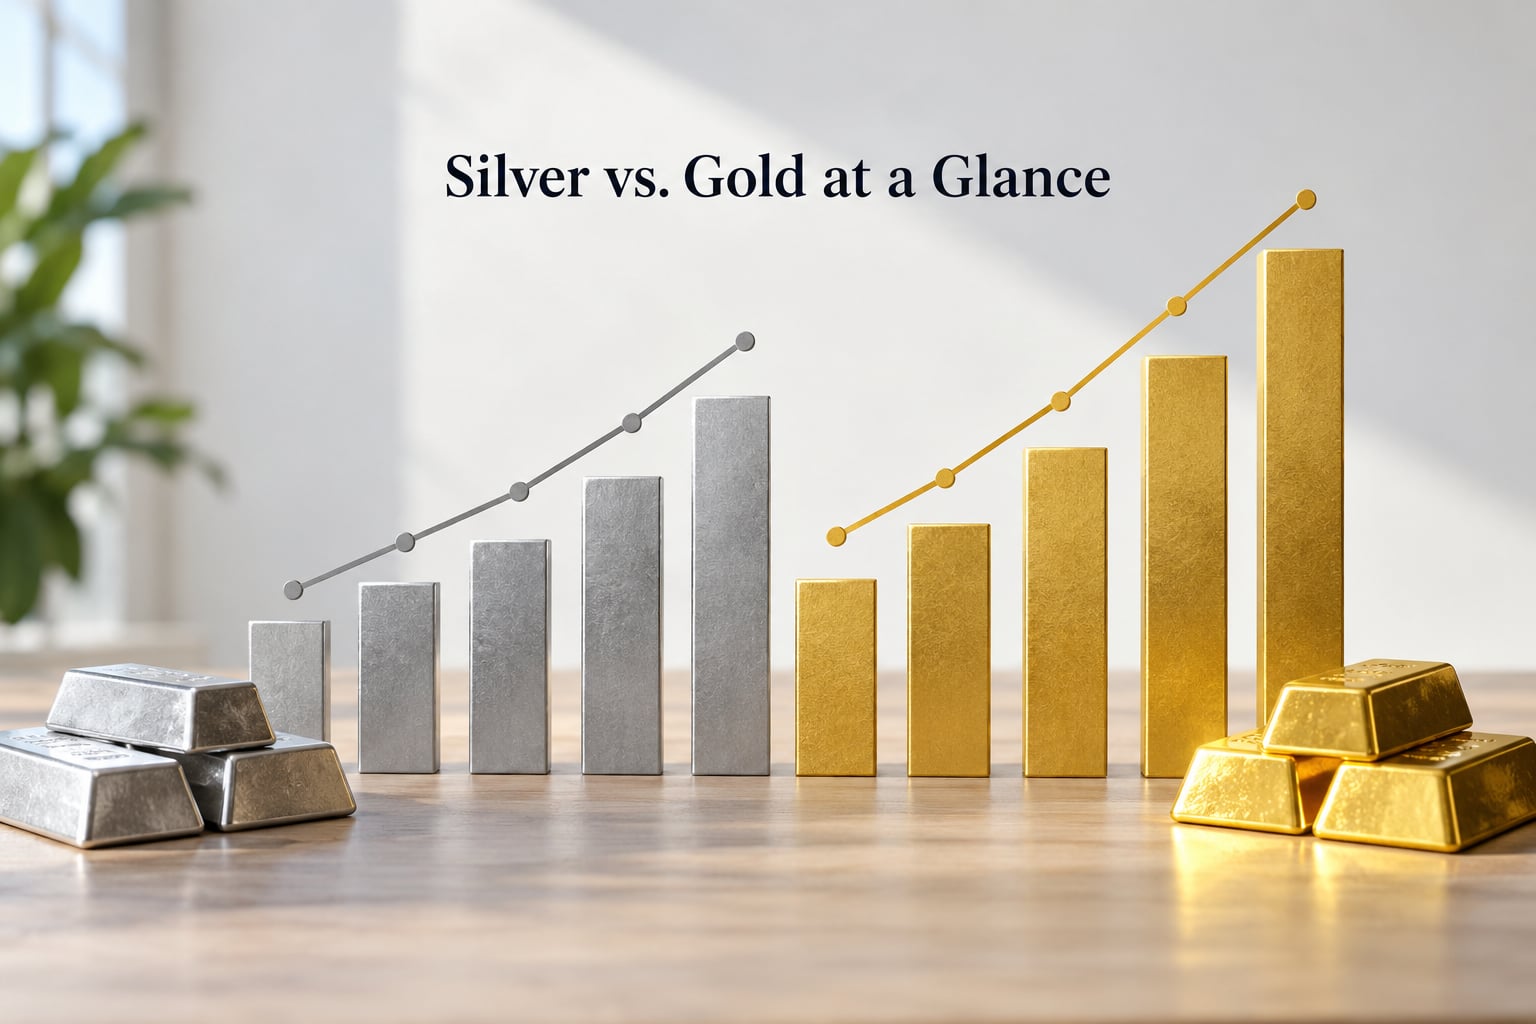
The table below is deliberately framed around why the two metals can diverge, not around fixed values that go stale. Volatility figures move with the regime, and market-size estimates depend on whose estimate you use.
| Factor | Silver | Gold |
|---|---|---|
| Approximate market size | Small fraction of the gold market — commonly estimated at roughly a tenth, though estimates vary by source and by which venues are counted | The far larger of the two markets by value traded, with deeper institutional participation |
| Typical market behaviour | Higher-beta, sentiment-driven, moves fast in both directions | Steadier, more institutional, reacts earlier to real-rate and reserve-demand shifts |
| Volatility | Annualized volatility has run as much as about twice gold’s over long windows | Lower volatility; the traditional defensive holding |
| Demand mix | Roughly 60% industrial — electronics, solar photovoltaics, electric vehicles, semiconductors, grid and networking | Overwhelmingly monetary and reserve demand, plus jewellery and bars |
| Supply responsiveness | Weak — about two-thirds of mine output is a by-product of other metals, so a higher silver price barely changes output | More direct — gold mines can respond to margins, and recycling responds quickly to price |
| Liquidity | Thinner; wider spreads, heavy retail share, heavy margin use in futures markets | Deep; tight spreads, heavy futures and options market, central bank participation |
| Typical investor use | The cyclical, higher-upside expression of a metals thesis; also a manufacturing and electrification proxy | Portfolio ballast, reserve diversification, crisis insurance |
Two rows carry most of the argument. The demand-mix row explains why silver has an engine gold does not, and the supply row explains why that engine pushes harder when it fires. Everything else is amplification.
5 Drivers of Silver’s Outperformance in Bull Markets
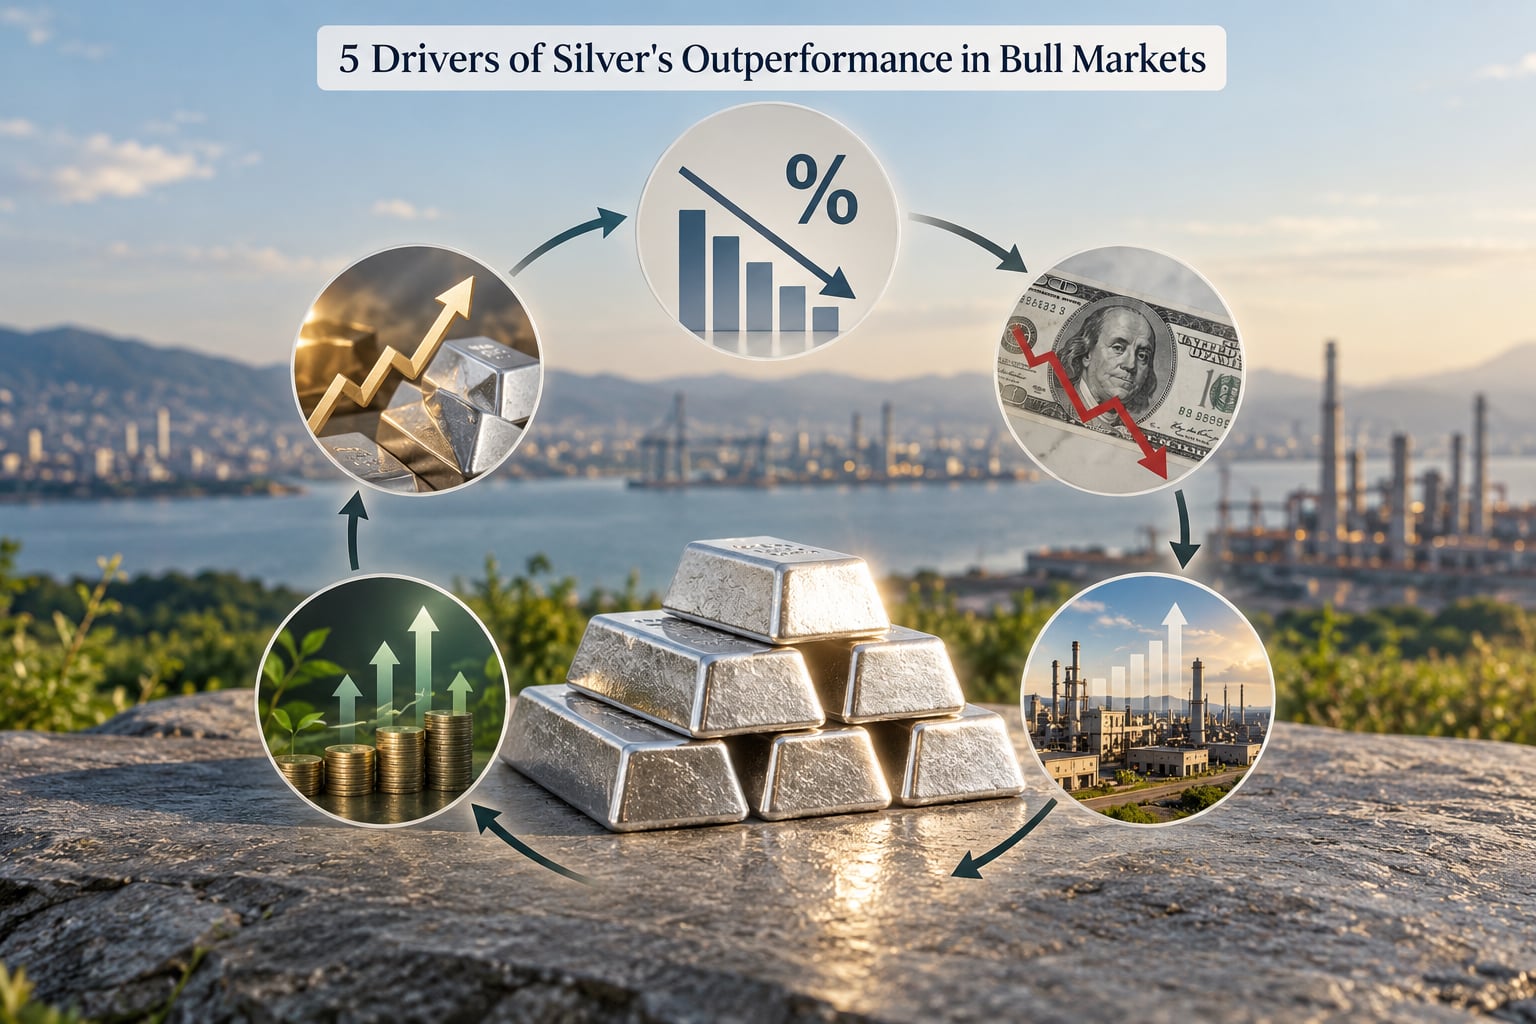
These five drivers work together rather than independently. Industrial demand is the fundamental leg, supply inertia is what keeps the market tight, market size determines how much a given flow moves price, and beta and momentum are the amplifiers that make the move visible in a chart.
1. Silver Has Higher Market Beta
Beta is just a measure of how much a price tends to move when the thing it follows moves. If gold rises 1% in a session and silver has historically risen about 2% in the same kind of session, silver’s beta to gold is roughly 2.
A simple illustration, not a historical result: if gold rose 5% over a quarter and silver’s beta to gold is about 2, silver would need roughly 10% to keep pace, and anything above that is outperformance. Plenty of quarters do not clear that bar, which is the honest part people skip.
Higher beta exists because silver’s market is smaller and thinner. The same dollar of buying has to work harder to find silver to buy. The same dollar of selling pushes it further too, which is why silver’s drawdowns are frequently as dramatic as its rallies.
It is worth separating what beta explains from what it does not, because the two get mixed together constantly. If silver simply rose twice as much as gold because it is a riskier version of the same trade, the outperformance would be mechanical and could not be improved on. In practice part of silver’s move comes from a source gold has no exposure to at all — actual metal being consumed by factories. That second part is the piece that shows up when you compare silver’s move against gold’s during a quarter of improving manufacturing data rather than a quarter of flight-to-safety demand.
So the honest framing is: beta tells you how much of silver’s move is borrowed from gold, and industrial demand tells you how much is silver’s own. A quarter driven by panic produces mostly the first. A quarter driven by growth produces more of the second.
2. Silver’s Industrial Demand Adds an Engine
Roughly 60% of annual silver consumption is industrial, and electronics alone absorbs on the order of hundreds of millions of ounces a year. Solar photovoltaic paste, semiconductor paste, contact points, switches, solder, catalysts, and the growing wiring and grid demands of electrification all consume metal that will not be recycled back into use quickly.
That matters for the bull case because industrial demand responds to growth. When manufacturing orders, construction spending and installation activity improve, silver gets a second bid on top of the monetary one. Gold has no equivalent leg — it is overwhelmingly a monetary and reserve asset, which is precisely why gold rallied hard in a period when inflation surged but did little else.
Newer demand sources keep getting added to the list: photovoltaic deployment, electric vehicles, grid upgrades, and the cabling and cooling infrastructure that comes with data-centre buildout. Each one adds a buyer who is not thinking about bullion at all.
3. A Smaller Market Creates a Tighter Price Response
Price elasticity is the reason a thin market moves so violently. The reported above-ground holdings of silver are enormous, but the investable float — bullion, exchange inventory and material actually available to buy in the moment — is a small fraction of it. Years of above-ground accumulation have built a huge hoard that barely participates in daily trading.
That is why small changes in investor flows produce outsized price changes. This is the core of why silver outperforms gold in bull markets: the same net inflow represents a far larger share of silver’s tradeable supply than of gold’s. A smaller market does not guarantee higher prices — it guarantees that flows are transmitted with less friction, in both directions.
The practical effect is a wider, faster reaction. A gold rally that grinds higher over months can show up in silver as a vertical move inside a few sessions, especially when it happens on thin overnight liquidity.
4. Supply Can Be Slower to Respond
About two-thirds of silver mine production is a by-product. It comes out of lead, zinc, copper and gold operations that are being mined for those metals, not for silver. A silver miner in a by-product deposit cannot simply open a new pit because silver is fetching more money per ounce.
By-product supply is set by the economics of the primary metal and by how those operations are already running. That means higher silver prices send a very weak signal to the supply side. New capacity takes years, existing by-product output responds only to changes in the host metal’s prices, and substitution in industrial use is limited by the electrical properties that make silver valuable in the first place.
Gold is different in a way that matters. A gold mine’s margins respond directly to the gold price, so higher prices bring more production and a strong scrap response within months. Gold also has deep recycling markets — when the price rises, scrap jewellery and industrial gold flows in quickly and cap the move. Silver’s scrap response is real but far smaller relative to demand.
The result is supply inelasticity: in a strong demand year, silver can run a deficit year after year while gold can lean on recycling and restarts to absorb strength.
5. Bull Markets Can Trigger Momentum and Short Covering
After a technical breakout, three amplifiers show up. Trend-following systems add exposure as the trend confirms, margin-driven futures money chases the move because the payoff is convex, and shorts who sold silver on the way up have to buy it back at the worst possible time.
Short covering deserves particular respect in silver. Because the market is smaller and futures are a large share of trading, a single well-timed exit can produce a violent squeeze. These episodes feel like evidence of a structural shift and usually are not — they are flow mechanics, and they reverse just as fast.
That distinction matters for how you read a chart. Momentum confirms what industrial demand and supply deficits have already started. It is not a substitute for them, and treating a margin-driven squeeze as a fundamental signal is how people end up holding a metal that just had its sentiment reset.
What Economic Conditions Favor Silver Over Gold?
The environments most likely to help silver share a theme: growth expectations improving while the monetary tailwind stays in place. The table pairs each condition with the channel it uses and with the observation that would tell you the setup is failing.
| Condition | How it reaches silver | What would invalidate it |
|---|---|---|
| Falling real yields | Lowers the opportunity cost of holding a non-yielding metal, lifting both metals; silver’s beta amplifies it | Real yields turn back up, or nominal rate cuts arrive alongside a recession |
| A softer US dollar | Dollar-denominated metal prices tend to rise when the dollar weakens; silver’s thinner market amplifies the move | Dollar strength returns, driven by relative rate expectations or safe-haven demand |
| Improving global growth | Manufacturing upturn lifts industrial consumption, giving silver a second bid gold does not have | Manufacturing indicators roll over, or electronics and solar demand disappoint |
| Industrial and infrastructure stimulus | Grid, solar, vehicle and data-centre spending translate directly into silver consumption | Projects are delayed, cancelled, or thrifted to cheaper conductive metals |
| Rising inflation expectations | Supports monetary demand for both metals as a store of purchasing power | Expectations are anchored, or real yields rise and offset the effect |
| Safe-haven demand | Supports both metals during stress | This is the one that most often favors gold alone — crisis-driven demand tends to concentrate in gold |
| Investment inflows and ETF demand | New money into silver vehicles flows into a much smaller market and moves price further | Flows reverse, or new supply of the metal appears faster than expected |
Notice the last column. Every condition has a matching condition that undoes it, and several of them reverse at the same time as the originals.
Why Silver Does Not Always Outperform Gold
Here is the part most silver commentary skips. In a precious-metals bull market, the character of the rally decides who leads — and not every rally has the character silver needs.
- Recession and growth scares — demand for industrial metal falls exactly when the monetary bid strengthens, so gold can rally on fear while silver has one leg fighting it.
- Rising real yields — a higher real return on cash and bonds is a direct headwind for non-yielding metal, and it hits the higher-beta metal harder.
- Geopolitical flight to safety — in a genuine crisis, liquidity and convenience flow to gold first, as the more liquid of the two.
- Weak manufacturing data — a soft industrial economy removes silver’s differentiating demand leg entirely.
- Mine supply growth and substitution — new primary silver mines, higher by-product output, or industrial thrifting and substitution can cap silver’s move.
- Central bank buying — this is the asymmetry that matters most. Central banks hold roughly a fifth of mined gold and have been steady buyers, a structural bid silver simply does not have.
Gold’s central-bank bid is a real floor under gold and no floor at all under silver. When a rally is driven by reserve diversification, debasement fears or a crisis, that floor is exactly what you want holding you up.
Run the same question the other way and the asymmetry is easy to see. Is there a buyer willing to commit to years of silver demand the way a central bank commits to gold? There is no comparable institution. That does not make silver a worse metal, but it does mean the structural buyer of last resort is missing.
There is also a contrarian data point worth holding onto: the gold-silver ratio has compressed materially from the 50-to-90 range where it spent most of its history, which means on that single measure silver is no longer obviously cheap relative to its own past. A metric that looked compelling five years ago is a much weaker argument now.
And be honest about the hit rate. The retail metals community has spent years forecasting a return to a 20-to-1 or 40-to-1 ratio. That call has failed repeatedly, decade after decade, because the structural forces against it — industrial thrifting, ETF structures, and a central bank bid for gold that has no silver equivalent — are slower-moving than the enthusiasm that makes the forecast.
Ratios are descriptive, not predictive. Anyone presenting one as a target with a date attached is making a directional bet, not a measurement.
How Investors Can Measure the Silver-to-Gold Ratio
The gold-to-silver ratio is the number of ounces of silver it takes to buy one ounce of gold. The silver-to-gold ratio is the same thing inverted. One measures how expensive silver is relative to gold; the other measures how close silver is to gold on a relative basis.
Common shorthand uses the inverse, and this is why silver outperforms gold in bull markets often shows up as a falling gold-silver ratio. When silver is catching up to gold’s move, fewer ounces of silver are needed for one ounce of gold. A rising number means gold is pulling away.
| Gold-to-silver ratio | What it has generally signalled | How to read it |
|---|---|---|
| Above 80 | Historically treated as extreme stress or dislocation | Widely watched as a contrarian accumulation signal, though it can stay wide for years |
| 60 to 80 | Below its long-run average but not extreme | Neutral zone; most of the past several decades has sat here |
| 50 to 60 | Closer to gold than the long-run average | Historically associated with late-cycle precious-metals strength and emerging caution about overextension |
| Below 40 | Historically rare, concentrated in the most violent metals manias | Rarely a comfortable holding condition; driven by squeeze dynamics more than fundamentals |
Use it as a thermometer, not a signal. It tells you how silver has performed relative to gold, which is useful context. It cannot tell you what happens next, and the correlation breaks down whenever central bank demand, an industrial cycle or a supply disruption dominates the flow.
There is also a way to watch the ratio’s own momentum. If the ratio has been grinding lower for months while both metals rise, silver is absorbing new demand rather than just tracking gold. If the ratio widens during a strong metals rally, the extra buying is going to gold, and that is a sign to expect silver to lag until it changes. People who watch only the silver chart tend to notice this too late.
Monitor it alongside the gold and silver trends themselves, real yields, the dollar, manufacturing indicators, futures positioning, and mine supply data. Read together, those inputs tell a coherent story. Read alone, the ratio is a single number that gets quoted far more confidently than it deserves.
Key Factors to Monitor Before Acting
Use this as a monitoring checklist rather than a trading system. None of these inputs guarantees anything, and the regime can change between one reading and the next.
- Real yields — the single most consistent driver of both metals. A sustained fall in real rates supports the whole complex.
- The US dollar — persistent dollar strength suppresses both metals, and it hits silver harder.
- Gold’s and silver’s own trends — confirm the move is not a one-day event against the prevailing trend.
- Manufacturing indicators — the honest test of silver’s industrial leg. If these are falling, the outperformance case is weak.
- Solar and electronics demand — install rates, semiconductor output and vehicle electrification are the physical demand signal behind the numbers.
- Futures positioning — speculative positioning and open interest tell you how much of the move is flow rather than fundamentals.
- ETF flows — persistent inflows into silver vehicles suggest new demand; a persistent drift the other way matters just as much.
- Supply data — mine output, by-product recovery rates and reported deficits or surpluses.
One more thing belongs on the list: cost. Silver carries wider spreads and higher storage and insurance costs relative to the value stored, and physical purchases often include premiums over spot. Retail buyers also meet sales tax rules that can make bullion a worse standalone holding than gold in some accounts.
That is not a reason to avoid silver. It is a reason to size it deliberately, and to check whether a lower-cost vehicle suits how you intend to hold it before you commit to physical metal you plan to move at some point.
A simple framing for ordinary holders: gold is the part of the allocation you do not expect to touch, and silver is the part you would size smaller because of what it can do to a portfolio in a bad month. Nothing about that requires a view on any price, and it keeps the position size consistent with the risk you can actually carry. Anyone who finds that framing uncomfortable is better off holding one metal than running an allocation sized for a stable holding inside a volatile one.
Frequently Asked Questions
Does silver outperform gold in every bull market?
No. Silver leads when the rally is driven by growth, falling real yields, a softer dollar and improving industrial demand. Gold leads when the rally comes from recession fear, geopolitical crisis, or a central bank diversifying reserves, because that demand has no silver equivalent. A precious-metals bull market is not automatically a silver bull market.
What makes silver rise more than gold during a precious-metals rally?
Five things: a higher beta to gold, an industrial demand base of roughly 60% of consumption, a much smaller and thinner investable float, mine supply that is about two-thirds by-product and barely responds to price, and momentum flows such as short covering. Together they let the same change in investor demand produce a much larger percentage move in silver.
Is silver more volatile than gold, and why does that matter?
Yes. Over long windows silver’s annualized volatility has run as much as roughly twice gold’s, driven by its smaller market size, thinner liquidity, heavy retail participation and heavy margin use in futures markets. That volatility cuts both ways. Silver gives more upside in a strong advance and gives back more in a reversal, so position size matters more than it does for gold.
Does the gold-to-silver ratio predict when silver will outperform?
Not reliably. The gold-to-silver ratio measures how expensive silver is relative to gold, and it describes what has already happened rather than what will. Levels above 80 have historically been watched as contrarian accumulation signals, but the ratio can stay wide for years. Treat it as context alongside real yields, the dollar, manufacturing data and positioning.
Which economic indicators are most useful for comparing silver and gold?
Real yields and the US dollar matter most for both metals. Manufacturing indicators decide whether silver’s industrial leg is helping or hurting, and the gold-silver ratio shows how silver has been tracking gold. Futures positioning and ETF flows separate genuine demand from momentum. No single indicator predicts outperformance, which is why silver outperforms gold in bull markets only under a specific combination of them.
Conclusion
Silver’s outperformance is never automatic. It needs a specific combination: stronger risk appetite, falling real yields, dollar weakness, industrial demand improving, and supply that stays tight because it is mostly a by-product. Remove any one of those and gold is often the better performer.
Start with the gold-to-silver ratio, then check it against macro and flow signals before drawing a conclusion. The most useful first step is the least dramatic one: look at real yields, the dollar and manufacturing data together, and ask whether the industrial leg is actually working right now. If it is, silver’s case rests on structure. If it is not, you are looking at a higher-beta gold position wearing a different name.
This is general market analysis, not personal investment advice, and past performance does not guarantee future results. Rules and conditions change, so verify current data before acting on anything here.