An inverted yield curve is a market condition in which short-term government bond yields are higher than long-term bond yields, so the curve that normally slopes upward slopes downward instead.
Practically, it means the 2-year Treasury yield has moved above the 10-year yield, and the market is pricing a slowdown and a central bank that will eventually cut. Bond traders treat it as a warning about growth, not a forecast of any particular asset price or a dated recession announcement.
Before the inversion is worth anything, you need the basics right. Three things explain most of what follows:
- A yield curve is a graph. Interest rates sit on the vertical axis, time to maturity on the horizontal axis. Each point is a government bond yield.
- Normally it slopes upward. Lending money for ten years carries more risk than lending for three months, so investors demand a term premium. Longer bonds pay more by design.
- Inversion is the exception. When the short end sits above the long end, something has changed in the price of risk or in the expected path of policy rates.
The rest of this guide works through how to read the curve, why it inverts, what its recession record actually looks like, and what a rational investor does with the information.
Table of Contents
- What an Inverted Yield Curve Means
- How to Read an Inverted Yield Curve
- What an Inverted 2-Year/10-Year Curve Means
- Why Does the Yield Curve Invert?
- Does an Inverted Yield Curve Predict a Recession?
- What Does Re-Steepening Mean After an Inversion?
- How Investors Should Respond to an Inverted Curve
- What an Inverted Yield Curve Means for Bonds, Equities, and Commodities
- Common Misconceptions About Yield-Curve Inversion
- Frequently Asked Questions
- How long can a yield curve stay inverted?
- Does an inverted yield curve mean the Federal Reserve will cut rates immediately?
- Why are two-year Treasury yields higher than ten-year Treasury yields?
- Does an inverted yield curve mean gold prices will rise?
- Which economic data should investors watch after a yield-curve inversion?
- Conclusion
What an Inverted Yield Curve Means
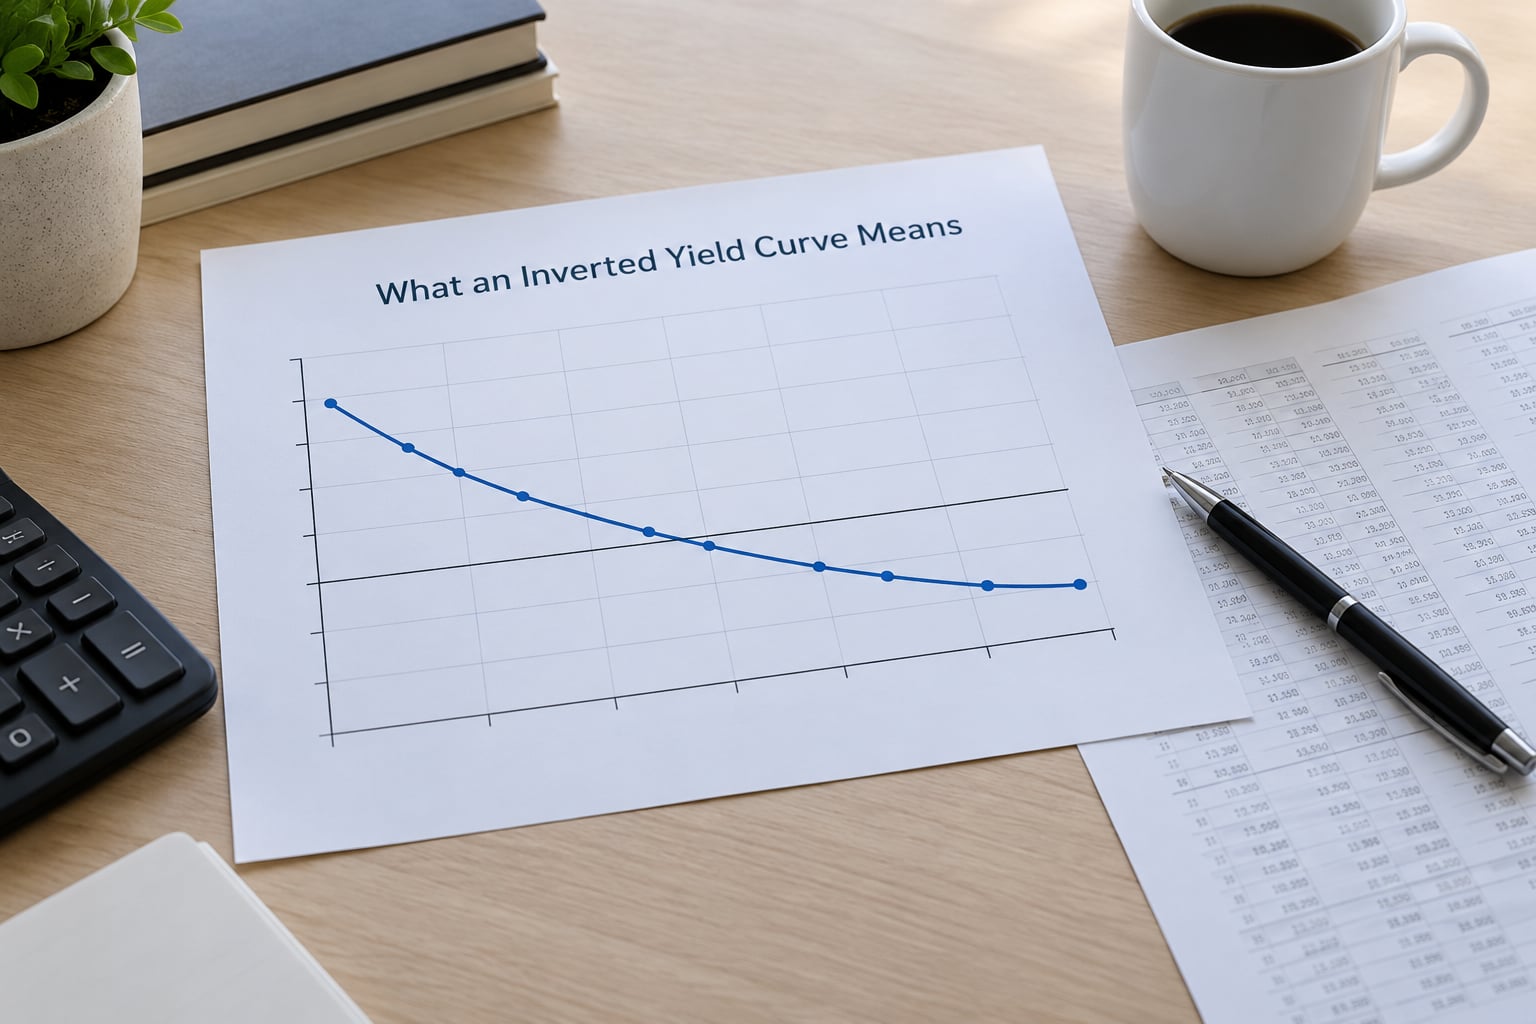
Strip away the commentary and an inverted yield curve means one thing: money markets are paying you more for a short commitment than the bond market will pay you for a long one. That is unusual, and it is worth understanding why it happens before deciding what to do about it.
The expectation hypothesis is the cleanest starting point. If bondholders expect short-term rates to be lower in two years than they are today, then locking in a 10-year rate that is below today’s 2-year rate is rational. Long rates are, roughly, the average of expected future short rates plus a term premium. Strip the term premium out and an inversion is a market statement about the future path of policy.
There are two practical readings of that statement, and they are not the same thing. The soft reading is a central bank that has raised rates aggressively and will need to cut as growth cools. The harder reading is that markets see a genuine slowdown coming, where a recession pulls inflation lower and forces cuts harder and faster. The shape of the curve alone does not tell you which one is priced.
What it is not is a countdown. Inversion has preceded many recessions, plenty of false alarms, and at least one long stretch where nothing much happened for years. Treat it as a shift in the odds.
How to Read an Inverted Yield Curve
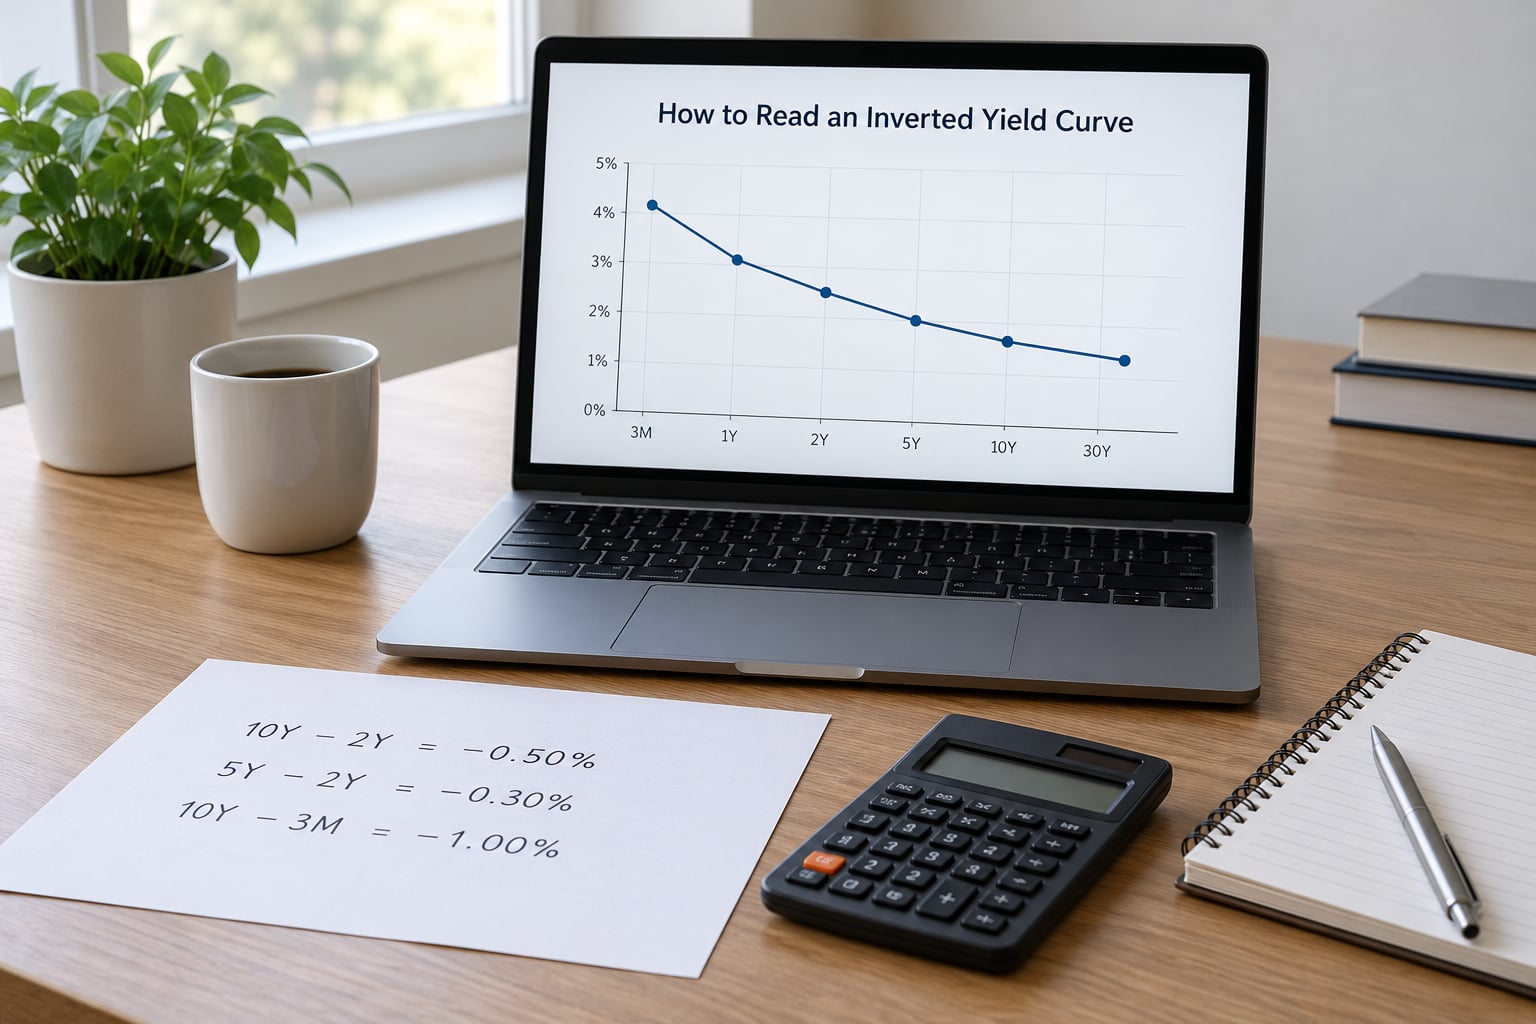
You read the curve by subtraction. A yield spread is simply one maturity’s yield minus another’s, and inversion exists when that number turns negative. Nearly all published commentary uses one of two pairs.
| Measure | How it is calculated | Example figure (illustrative) | Reading |
|---|---|---|---|
| 2s10s | 10-year yield minus 2-year yield | 4.05% minus 4.30% = -0.25% | Inverted. The benchmark US measure. |
| 3m10s | 10-year yield minus 3-month bill yield | 4.05% minus 4.55% = -0.50% | Inverted, and a wider warning than 2s10s. |
| 5s30s | 30-year yield minus 5-year yield | 4.70% minus 4.20% = +0.50% | Still positive. A partially inverted curve. |
A negative number means inversion. A positive number means the curve is upward sloping at that point, though the size still tells you something. A spread of +0.05% is effectively flat, and many people describe anything under roughly +0.25% as flattened rather than properly sloped.
Two distinctions matter in practice. First, 2s10s and 3m10s can disagree. The 3-month bill is the closest thing to a pure policy expectation, while the 2-year carries some expectation of future policy plus a small term premium, so the 2-year usually goes negative first and the 3-month can stay lower or higher for months.
Second, a curve can be partially inverted, with the short end flipped but the 5-to-30-year part still rising. Plenty of headlines called that a full inversion. It is a warning, but a softer one than every segment turning negative together.
One technical footnote. Official yield curve data is published as par yields, which assume coupons are reinvested at the same rate, while some academic and model-based series use zero-coupon yields. The two can diverge by a few basis points, which matters only when you are looking at a spread hovering right around zero.
To check it yourself, three sources cover it. The US Treasury publishes a daily par yield curve every business day. FRED carries the T10Y2Y and T10Y3M series, free and downloadable. The New York Fed publishes a recession probability model that rolls several indicators into one number, useful as a sanity check against your own read.
What an Inverted 2-Year/10-Year Curve Means
The 2s10s spread is the measure most people mean when they say the curve is inverted, and it is the one with the deepest recession record. Understanding it means separating the two ends of the curve, because they respond to different forces.
The 2-year end is close to a policy forecast. It moves on what the central bank is expected to do over the next eight quarters, and it drops sharply when traders price in cuts. The 10-year end is a mix of expected inflation, expected long-run growth, the term premium investors demand for holding long bonds through uncertainty, and the supply of government debt the market has to absorb. Those forces often move in the same direction, which is why the curve normally slopes up. When they diverge, you get an inversion.
The 2022 episode is the clean example. Short rates rose fast because the central bank was fighting inflation, and two-year yields followed policy tightly. Ten-year yields rose much less, and at times fell, as investors priced weaker growth, more government debt issuance, and a less certain inflation path.
Two patterns follow from this and confuse a lot of readers. Re-inversion happens when the curve comes back toward positive and then flips negative again as the economy rolls over, which is why a “recovery” in the spread is not always good news. A bear steepening while the curve is still inverted, with long yields rising faster than short yields, is a different animal entirely, usually a sign of rising term premium or fiscal concern rather than a growth recovery.
Why Does the Yield Curve Invert?
Inversion is rarely one cause. It is usually the sum of a few forces landing at the same time, and they usually arrive in this order.
- Policy tightening lifts the short end. When a central bank raises its policy rate, maturities inside roughly two years reprice almost immediately. This is the single most common cause and it does the heavy lifting.
- Expected growth slows. Long yields fall as traders trim expected future short rates. If the central bank is expected to cut in response, the long end drops faster than the short end rises.
- Expected rate cuts get priced in. An inversion is often the market getting ahead of the central bank rather than warning of something the market has not seen. The curve is forward-looking by construction.
- Bank or credit stress appears. In 1998 the inversion came with funding pressure after the Russian default and the collapse of Long-Term Capital Management. Investors wanted safety and duration, and a flight to quality pulled long yields down.
- Long-end supply and inflation risk bite. Heavy government debt issuance, or a market that suddenly wants a higher inflation premium, can hold long yields up or push them up. Combined with high short rates, that produces a flattening first and an inversion only if long yields then give ground.
That last point explains the difference between flattening and inversion. A flattening curve still slopes up, just barely, and usually means forces are balancing. An inversion means the balance has tipped and the market is explicitly pricing lower short rates ahead.
Does an Inverted Yield Curve Predict a Recession?
It is a decent warning, and a poor calendar. Every US recession since the 1950s except 1998 was preceded by an inversion, which is a genuinely impressive record. The problem is the timing, which ranges from a few months to more than two years, and the fact that inverted curves sometimes sit there for years without anything breaking.
| Inversion began (approx.) | Recession onset (approx.) | Lead time | Outcome |
|---|---|---|---|
| 1969 | Late 1969 | Roughly 12 months | Recession followed |
| 1973 | Late 1973 | Roughly 10 months | Recession followed |
| 1978 | Early 1980 | Roughly 20 months | Recession followed |
| 1980 | Early 1980 | Already under way | Recession followed |
| 1981 | Mid 1981 | Roughly 6 months | Recession followed |
| 1989 | Mid 1990 | Roughly 12 months | Recession followed |
| 1998 | No recession | Did not happen | False signal |
| 2000 | Early 2001 | Roughly 18 months | Recession followed |
| 2006 | Late 2007 | Roughly 18 months | Recession followed |
| 2019 | Early 2020 | Roughly 15 months | Recession arrived, but the cause was the pandemic, not the 2019 slowdown |
| 2022 (March) | None on the usual schedule | More than three years | Longest wait in the modern record; the call was repeatedly pushed out |
Dates are approximate and depend on which source you use for the recession start. The pattern to take away is a typical lead time in the 12 to 18 month range, with a long tail on either side.
Two cases deserve a note. The 1998 inversion never produced a downturn; the economy grew, largely because policy easing and productivity offset the slowdown the curve was pricing. The 2019 inversion did coincide with a recession, but the cause was an external shock that no yield curve could have forecast, which makes the “success” partly a coincidence.
Then there is 2022. The curve inverted in March 2022 and stayed inverted through the longest sustained stretch in the modern record, running for years with no recession on schedule. Several things explain the delay: fiscal transfers and savings supported household spending, immigration kept the labour supply growing, productivity picked up, and banks were recapitalised after the 2023 stress rather than undercapitalised.
So does inversion predict a recession? It raises the probability of one over the following year or two. It does not tell you the month, it does not tell you the cause, and it does not tell you how bad it will be for markets.
What Does Re-Steepening Mean After an Inversion?
Re-steepening is when the spread moves back toward positive. Media usually treats that as the all-clear, and that reading is often wrong, because two very different moves share the name.
A bull steepening happens when short rates fall faster than long rates, usually because the central bank is cutting. If the cut is a response to a genuine slowdown, equities often fall even as the curve un-inverts, because the reason the curve improved was bad news. A bear steepening happens when long rates rise faster than short rates, which points to higher inflation expectations, more government debt supply, or rising term premium. That is not a growth signal at all.
This is the single most misread moment in the whole cycle. “The curve un-inverted” is a mathematical fact. Whether it is good news depends entirely on which end moved and why. The long stretch after 2022 made the point painfully well, with the curve repeatedly re-steepening and re-inverting while the underlying growth picture stayed soft.
A return to a positive spread also does not mean the economy will expand. It means the market’s relative pricing of near-term and long-term rates has changed. The growth forecast lives in the level and direction of yields, not just the gap between them.
How Investors Should Respond to an Inverted Curve
There is no one right response, and anyone telling you there is is selling something. What follows is a checklist of things worth checking, not personal advice, and the mechanics differ in every country.
- Confirm which pair you are actually looking at. 2s10s, 3m10s and 5s30s can tell different stories on the same day. Pick the measure, note its source, and stay with it.
- Check the breadth of the inversion. A full inversion across the whole curve is a stronger warning than a single flipped segment.
- Look for corroboration in credit. High-yield and investment-grade spreads tell you whether the slowdown is priced only in rates or across risk assets too. Widening credit spreads with an inverted curve is a more serious combination than either alone.
- Watch labour data. Weekly unemployment claims and payroll trends are the cleanest real-time read on whether a slowdown is actually arriving.
- Compare the signal with earnings and valuations. A recession signal matters most when profit margins are already thin and multiples are already high, and much less when valuations are depressed.
- Do not trade a single spread move on its own. One day of steepening is noise. Sustained moves across several months, confirmed by other indicators, are what carry information.
On portfolio construction, a few general points. Holding a lot of short-duration assets gives up upside if growth holds up, so a total switch to cash is its own bet. Leveraged or borrowed positions are where a growth shock hurts most, and a long stretch of inverted curve usually means higher rate volatility along the way. If you hold bonds inside a retirement account, tax treatment changes the arithmetic, and laddered maturities reduce the sting of buying at a bad point on the curve. None of this is a recommendation; it is the shape of the trade-off.
What an Inverted Yield Curve Means for Bonds, Equities, and Commodities
There is no mechanical mapping from the curve to asset returns. What matters is which of the forces above is doing the work, and the effects are conditional rather than automatic.
Two-year Treasuries. These track policy expectations most closely. An inversion that unwinds through falling short rates usually means cuts are being priced in, which historically comes with some combination of slower growth and lower inflation.
Ten-year Treasuries. Longer bonds respond to inflation expectations, term premium and debt supply, so they can rise during an inversion if investors demand a higher return for holding duration. If growth worries dominate, they rally instead. Both have happened repeatedly in recent years.
Growth-sensitive equities. Software, small caps and consumer discretionary names carry the most exposure to a slowdown in expectations, and they tend to react before the data confirms anything. Defensive sectors and larger quality companies usually hold up better, though not always in the first weeks of a shock.
Banks. A flatter curve compresses net interest margins, since banks borrow short and lend long. That is a slow structural squeeze rather than a shock, and it hits lender earnings before it hits the balance sheet.
Gold. Inversions sometimes accompany demand for assets that hold value when policy is easing and real yields fall, which gold has historically done well through. But gold responds far more directly to real interest rates, the dollar and central bank buying than to the shape of the curve, and it has fallen during some inverted periods too.
Industrial commodities and mining equities. These are leveraged to the growth outlook rather than to the signal itself. A slowdown in expectations tends to weigh on base metals, while precious metals tend to track the real-rate story instead. That distinction matters for anyone running a metals and mining portfolio through an inverted cycle.
Common Misconceptions About Yield-Curve Inversion
Inversion guarantees a recession. It raises the odds. The 1998 inversion never produced one, and the 2022 inversion ran for more than three years without the recession that was widely expected to follow.
A positive curve means the economy will expand. A positive spread only means short rates are below long rates again. If it came from falling short rates in response to a slowdown, the economy can keep contracting with a normal-looking curve.
All inversions are the same. A single flipped segment, a full inversion and a curve re-inverting for the third time are three different situations with three different meanings.
The spread predicts exact asset prices. It says something about the expected path of policy rates. Equity multiples, gold and oil have their own drivers, and the correlation is loose at best.
One steepening day reverses the signal. Markets re-invert and re-steepen repeatedly, sometimes for years. The pattern matters over months, not over a session.
Frequently Asked Questions
How long can a yield curve stay inverted?
Inversions have lasted anywhere from a few months to more than three years. The 2006 and 2000 episodes ran roughly 18 months before recession, while the inversion that began in March 2022 lasted years without the recession that followed earlier episodes. Duration alone tells you very little, which is why investors watch credit spreads and labour data for confirmation.
Does an inverted yield curve mean the Federal Reserve will cut rates immediately?
No, and this is the most common misreading. Inversion often happens while the central bank is still raising, because markets price in future cuts well before policymakers act. In 2022 the two-year yield crossed below the ten-year while policy rates were still climbing. The curve describes what investors expect over the next several quarters, not what a central bank committee decides at its next meeting.
Why are two-year Treasury yields higher than ten-year Treasury yields?
Because markets expect short-term rates to come down from their current level. Long-term yields reflect expected inflation, long-run growth, the term premium and government debt supply, while two-year yields track expected policy over the next eight quarters. When the expected path of short rates falls faster than long rates fall, the curve flips negative. Bank or credit stress can produce the same shape through a flight to quality.
Does an inverted yield curve mean gold prices will rise?
Not reliably. Gold’s main drivers are real interest rates, the US dollar, central bank buying and risk sentiment, and those can point in different directions during an inversion. Gold has rallied during some inverted periods as investors sought assets that hold value when policy eases, but it has also fallen in others when real yields or the dollar rose. Use the curve as background context, not as a precious-metals signal.
Which economic data should investors watch after a yield-curve inversion?
Start with weekly unemployment claims and monthly payrolls, then add high-yield and investment-grade credit spreads, manufacturing and services PMI, and consumer confidence. Adding the New York Fed recession probability model gives you a single number to sanity-check against your own reading. If the curve is inverted and credit spreads are widening at the same time, the warning carries more weight than the curve on its own.
Conclusion
An inverted yield curve means short-term government bond yields sit above long-term yields, which tells you markets expect a slowdown and lower policy rates ahead. It is a risk signal, not a schedule.
The first action is a small one: check the spread you care about, whether 2s10s or 3m10s, and note its source. Then confirm whether credit spreads, labour data and inflation expectations support the warning before treating it as anything more than background noise for your portfolio.
Rates, rules and market structure vary by country and change over time, so none of this is individual investment advice.