The velocity of money is the average number of times a single unit of currency is used to buy goods and services in a given period, usually a year. You calculate it by dividing nominal GDP by the money supply, so a reading of 1.4 means the average dollar did about one and a half rounds of spending per year.
It is a ratio, not a thing you can watch move. Nobody counts each bill as it changes hands, so economists infer the answer by dividing the total value of goods and services produced in a year by the average stock of money sitting in bank accounts and wallets.
Below, I walk through the formula, a worked example, why it matters for inflation, and where investors actually find the numbers. I also cover the personal-finance version of the same phrase, because readers searching this term often arrive expecting that one and end up confused by the macro version.
Table of Contents
- What Is the Velocity of Money?
- How Is the Velocity of Money Calculated?
- Why Does Money Velocity Matter for Inflation and the Economy?
- What Causes the Velocity of Money to Rise or Fall?
- How Do Interest Rates and Central Banks Affect Money Velocity?
- How Does the Velocity of Money Affect Inflation?
- Is Money Velocity the Same as the Money Supply?
- How Can Investors Use the Velocity of Money?
- What Are the Limitations of Using Money Velocity Data?
- Frequently Asked Questions
- What is velocity in simple terms?
- How do I calculate the velocity of money?
- What is the velocity of money in the US right now?
- What is the velocity of the US dollar?
- Is a higher velocity of money better?
- How does the velocity of money affect inflation?
- The Bottom Line on Money Velocity
What Is the Velocity of Money?
In plain terms, the velocity of money tells you how often the average unit of money gets spent rather than parked. If a country produced 1,000 dollars worth of goods and services and held 500 dollars in total, velocity was 2 — each dollar did two turns.
The number is not the same as the money supply. The money supply is a stock: the pile sitting there at a point in time. Velocity is a flow: how many times that pile circulates in a year. A big pile that nobody touches has low velocity, and a smaller pile in constant motion has high velocity.
One-sentence version: the velocity of money is the average number of times a unit of currency changes hands to pay for goods and services within a specific period.
It also differs from currency in circulation, which counts physical notes only. The standard US velocity measures use bank deposits, because most spending today happens electronically rather than in cash.
How Is the Velocity of Money Calculated?
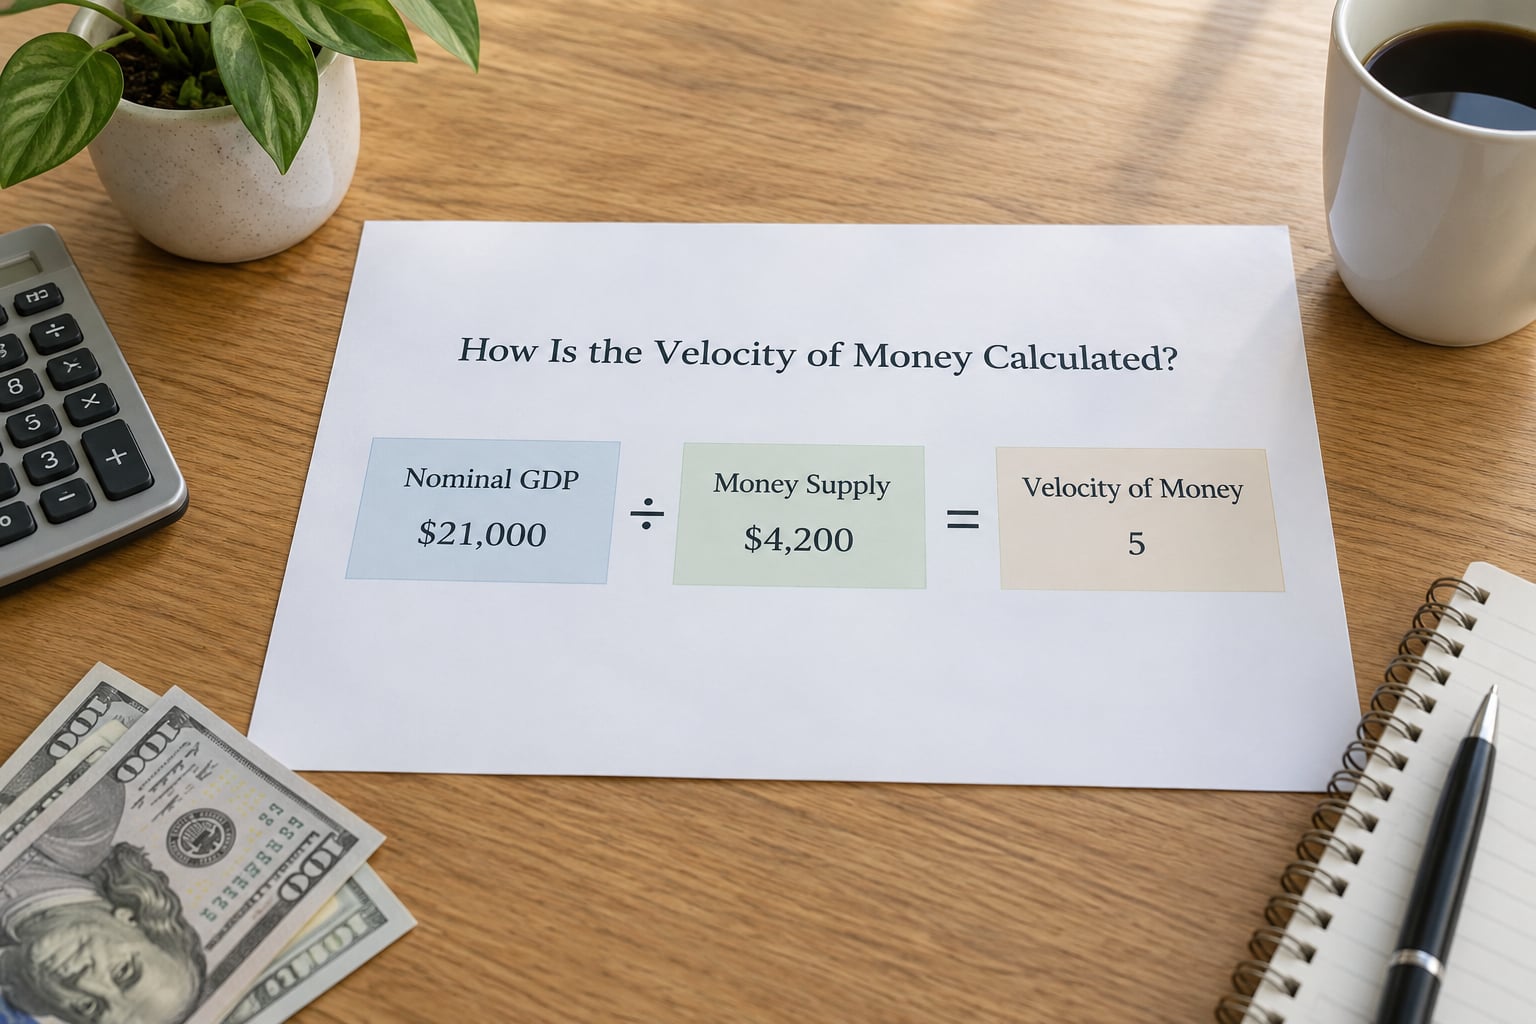
The formula is one division:
Velocity of money = Nominal GDP / Money Supply
The pieces:
- Nominal GDP — the total value of everything the economy produced in a year, measured at current prices. Because it is nominal, it already includes inflation.
- Money supply — the aggregate used to define the series. M1 is the narrow measure, mostly cash and checking deposits; M2 adds savings accounts and small time deposits.
Here is a worked example. Suppose nominal GDP for a year is 24,000 billion dollars and the average M2 stock is 17,000 billion dollars. Velocity is 24,000 divided by 17,000, which comes to roughly 1.41. Each dollar in the system was spent on about 1.4 dollars of final output over the year.
| Component | Value (annualised) | Role in the calculation |
|---|---|---|
| Nominal GDP | 24,000 billion dollars | Numerator — total value of output at current prices |
| M2 money supply | 17,000 billion dollars | Denominator — average stock of money held |
| Velocity (M2V) | 1.41 | Result — times the average dollar changed hands |
Economists also use a second version, transactions velocity, written V = PQ/M, where P is the price level and Q the real volume of transactions. It comes out of the equation of exchange, MV = PQ, the identity at the heart of the quantity theory of money. Income velocity, the GDP-based measure above, is what the Federal Reserve actually publishes.
Two things about timing matter. First, the standard velocity series use annualised quarterly flows against quarterly average money stocks, so a single quarterly print tells you about the prior three months, not the quarter you are reading about. Second, velocity cannot be observed directly — it is a residual, calculated after the fact. That single fact explains most of the confusion people have with the number.
Why Does Money Velocity Matter for Inflation and the Economy?
Velocity decides how much buying power the same stock of money can generate. Add dollars to the system while people sit on them, and little happens. Add the same dollars when everyone is spending, and demand pushes prices higher.
It matters for growth too. A rising velocity usually shows up when businesses are confident, credit is easy and consumers feel safe spending their income. A falling velocity is the classic signature of caution, and it tends to accompany slow growth or recession.
But be careful with the arrow. The equation of exchange is an accounting identity, not a behavioural law. Money times velocity equals nominal spending, always, by construction. That means velocity helps describe what happened and why money supply figures alone tell an incomplete story. It does not, on its own, predict prices.
What Causes the Velocity of Money to Rise or Fall?
Several things move it, and they rarely all point the same direction at once.
- Interest rates on savings. When deposits pay more, holding cash feels productive and money stays put.
- Income and job security. Workers with rising pay and steady jobs spend a larger share of it; anxious workers save the raises they get.
- Confidence. Expectations of better times pull spending forward. Fear does the reverse.
- Credit availability. Cheap borrowing lets people spend money they have not earned yet, adding velocity without adding dollars.
- Payment technology. Faster settlement and one-tap checkout lower the friction of paying, so money cycles more often.
- Cash hoarding. Physical notes hidden at home sit outside many money supply measures entirely, which distorts the ratio.
- Demographics. An older population that has already bought its home tends to save more and turn money over less.
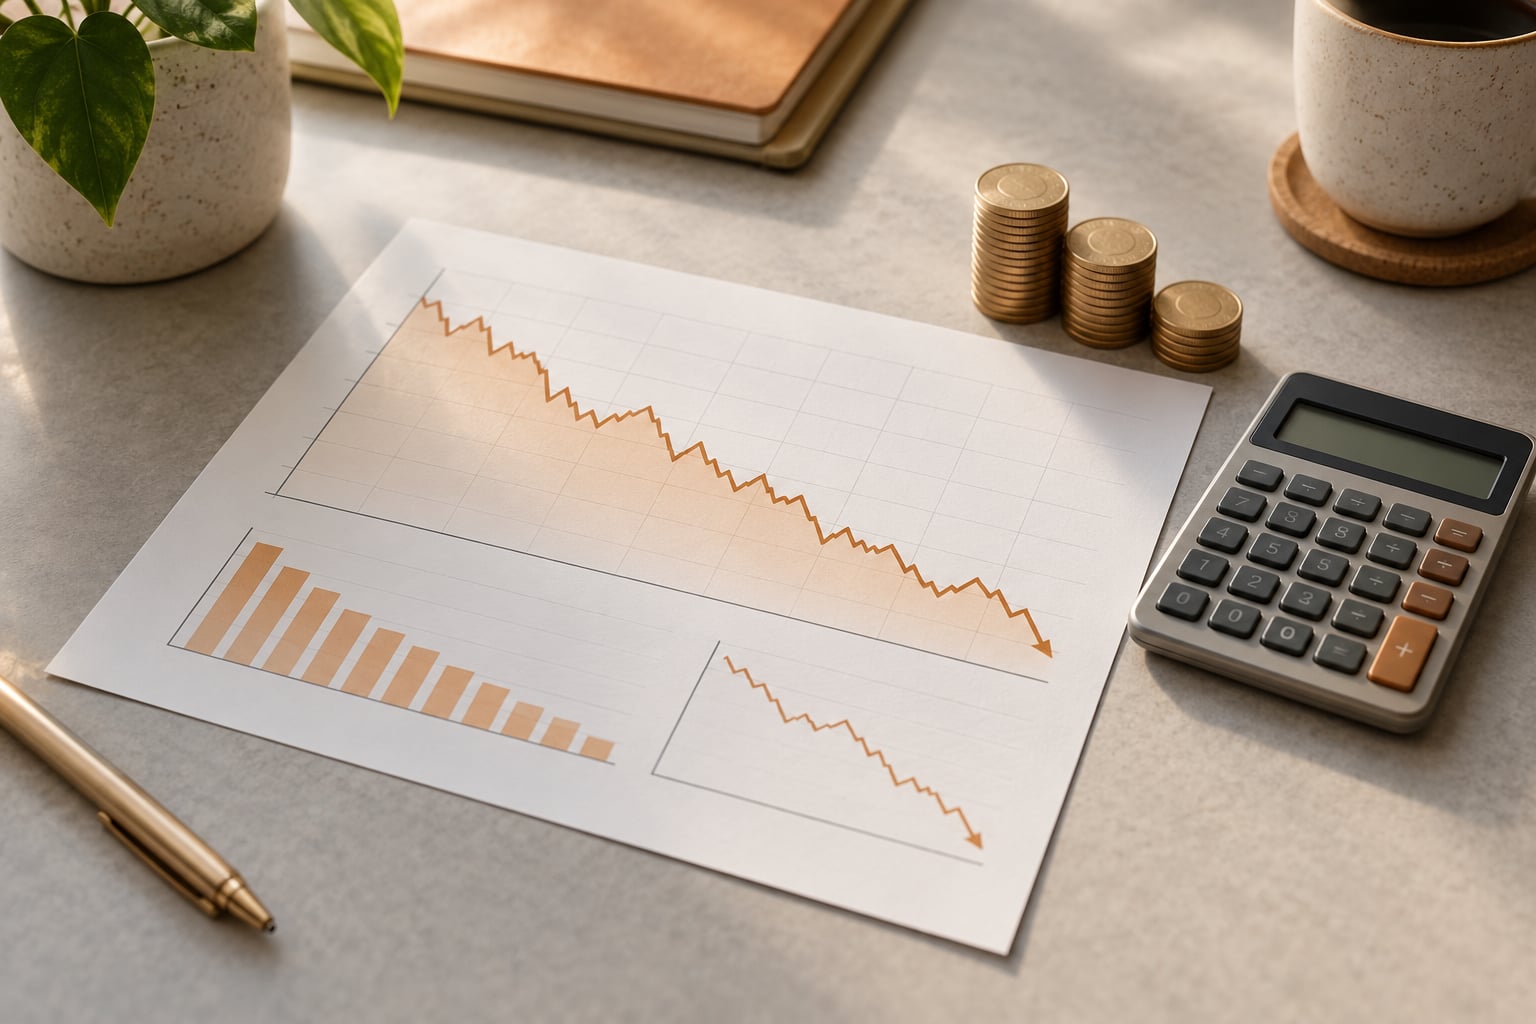
Since 2008, US M2 velocity has trended lower for most of the period, hovering around 1.4 recently against an average close to 1.9 over the long stretch from 1959 to 2007. The pandemic briefly pushed it to a record low near 1.13 in mid-2020, as households and businesses parked cash and stimulus money sat idle in accounts.
How Do Interest Rates and Central Banks Affect Money Velocity?
Rates shape the opportunity cost of holding money. When short-term deposit yields rise above inflation, keeping cash is a rational choice rather than a failure of confidence, so velocity drifts down. Lower rates erase that advantage, and money moves back into spending.
Balance-sheet policy works along the same lines. Large purchases of assets put reserves into the banking system, and the effect depends entirely on what happens next: if borrowers spend them, velocity rises; if banks hold excess reserves or households pile up deposits, it does not. Central bankers cannot control velocity directly, which is why they talk about conditions rather than a target number.
The response is not immediate or uniform. Rates move in steps, contracts reprice slowly, and different households react at different speeds, so the link shows up over quarters rather than weeks.
How Does the Velocity of Money Affect Inflation?
Using the equation of exchange, MV = PY: money supply times velocity equals the price level times real output. Hold output steady and a doubling of both money and velocity means roughly a quadrupling of the price level, in theory.
In practice the chain rarely runs cleanly. Real output responds to demand, prices adjust at different speeds across sectors, and the money supply can change without anyone spending it. An increase in velocity is therefore not a guaranteed cause of consumer-price inflation.
That is the heart of the long-running argument. Monetarists have argued for decades that sustained monetary growth must show up in prices, and their critics reply that financial innovation, offshore dollar holdings and fiscal policy can absorb new balances for a long time before anyone sees it in consumer prices. Anyone tracking the 2026 inflation print should keep both positions in view.
Is Money Velocity the Same as the Money Supply?
No, and confusing the two is the most common mistake. Here is the side-by-side.
| Point of comparison | Money supply | Velocity of money |
|---|---|---|
| What it is | A stock of money at a point in time | A ratio: how often that stock circulates |
| How it is measured | Direct count of cash and deposits | Nominal GDP divided by the money supply |
| Can you observe it | Yes, from central bank balance sheet data | No, it is inferred after the fact |
| When it rises | Central bank or bank lending expands | Spending picks up or cash gets spent down |
| Publication frequency | Monthly | Quarterly, with a reporting lag |
| Typical interpretation | Fuel available for spending | How hard that fuel is being pushed |
The aggregation you pick also changes the answer. M1 velocity and M2 velocity are separate series with separate histories.
| Measure | What it includes | What its velocity measures |
|---|---|---|
| M1 | Currency, traveler’s cheques, checking and other liquid deposits | Turnover of spendable balances; more jumpy quarter to quarter |
| M2 | M1 plus small time deposits, retail money market funds and some retirement funds | Turnover of the broader savings and spending stock; the most widely quoted |
| M3 | M2 plus larger time deposits, institutional money market funds and repos | Closest proxy to all liquid financial assets; not published routinely in the US |
Redefinitions matter here. When the Federal Reserve changed what sits inside M1 in 2026, the historical series were recalculated, which is why older charts and current ones do not always match.
How Can Investors Use the Velocity of Money?

Read velocity as context rather than as a trigger. It tells you the backdrop against which prices, rates and earnings are happening.
Bonds. Falling velocity often accompanies weak growth and eventual rate cuts, which historically supports longer-duration bonds. It is a slow-moving confirmation of a trend, not a timing tool.
Equities. Rising velocity suggests businesses and households are transacting confidently, which tends to show up in revenues before it shows up in sentiment. Falling velocity, particularly with a still-rising money supply, is the pattern that makes investors ask where the money is actually going.
Commodities and precious metals. This is where the site’s bias shows through. When a money supply expands and velocity stays depressed, the extra purchasing power is not circulating in the real economy. Gold and silver tend to be where that balance shows up first, which is the reasoning behind the monetary-debasement argument, and it is a hypothesis rather than a rule. Our coverage of gold and silver market analysis is worth reading alongside the macro backdrop rather than as a stand-alone signal.
Cash. If you hold a portion in cash or short bills, velocity is a reminder that its purchasing power is being spent on other things. Low velocity does not rescue cash value; it just tells you the system is quiet.
None of this is investment advice, and rules and rates differ by country. As always, check the specifics where you live.
One more thing worth clearing up. House-flippers and REIT investors use the same words in a completely different sense: they mean how fast capital turns over, how many times the same dollar can be put to work in a year. A flipper with 50% returns twice a year has velocity of two. The arithmetic idea is shared; the economic meaning is not.
What Are the Limitations of Using Money Velocity Data?
It is worth being blunt about the weaknesses before you lean on any reading.
- It is a residual. Because you divide output by money, all the measurement error in both series lands in velocity.
- It is revised. GDP gets rewritten, money stock definitions change, and the whole history can shift under a chart you saved.
- Money has several definitions. Choose M1 or M2 and you get different answers, sometimes with opposite implications.
- Informal activity is invisible. Cash under the table is spent repeatedly but rarely counted.
- Sector differences are large. Household and corporate velocity move differently, so a national average can hide both.
- It lags. Quarterly, and published with a delay, so the newest number on the chart is already months old.
To pull the data yourself, go to the St. Louis Fed database, search for series M1V and M2V, set the frequency to quarterly, and note the observation dates rather than the release dates. Both series are published by the Federal Reserve.
Frequently Asked Questions
What is velocity in simple terms?
It is how many times the average unit of money gets spent on goods and services in a year. If the economy produces 1,000 dollars of output and holds 500 dollars of money, velocity is 2, meaning the average dollar did two rounds of spending. It describes circulation, not the size of the money supply.
How do I calculate the velocity of money?
Divide nominal GDP by the money supply, using M1 or M2. Nominal GDP is the value of everything produced at current prices, so it already reflects price changes. Divide annual nominal GDP by the average money stock for the same period. A reading of 1.4 means the average dollar was spent on about 1.4 dollars of output.
What is the velocity of money in the US right now?
US M2 velocity has been near 1.4, well below the long-run average close to 1.9 seen from 1959 to 2007. The most recent reading is always a few months old, because the Federal Reserve publishes velocity quarterly and each quarter covers the prior three months. Check series M2V and M1V in the St. Louis Fed database for the current figure.
What is the velocity of the US dollar?
There is no separate figure for an individual currency. The standard measure applies to the US dollar economy as a whole, computed from nominal GDP divided by M1 or M2. Some commentary uses the phrase loosely to describe how quickly money moves through markets, which is not a published statistic and cannot be compared across sources.
Is a higher velocity of money better?
It depends on what you are optimizing for. Higher velocity usually signals active spending, confident consumers and healthy business turnover. Lower velocity usually signals caution and slower growth. Neither is good or bad on its own. A rising money supply with falling velocity is the combination that tends to worry investors watching for unspent purchasing power.
How does the velocity of money affect inflation?
The equation of exchange says money times velocity equals the price level times real output. If output is steady and both money and velocity rise together, prices face upward pressure. In reality output moves too, so a velocity increase is not a guaranteed cause of consumer-price inflation. It is one input, best read alongside wage growth, credit conditions and the money supply itself.
The Bottom Line on Money Velocity
Start by pulling series M2V in the St. Louis Fed database and putting it next to the money supply growth line. The gap between a growing money stock and a velocity that refuses to rise is the single most useful thing this measure tells an investor in 2026.
Nothing here is a recommendation, and monetary rules differ across countries. Treat velocity as background noise with a signal buried in it.