
If you have ever compared two stocks by looking at a single number next to the ticker, you have probably met the price-to-earnings ratio. So, what is price to earnings ratio? It is the number of dollars investors pay for one dollar of a company’s annual profit, and it is the most quoted valuation multiple in equity investing.
The arithmetic is short: share price divided by earnings per share. Everything hard about the ratio comes afterward, in deciding whether a given number is rich, cheap, or simply reflecting a different set of expectations than the one you are holding.
Table of Contents
- Key Takeaways
- What Is a Price to Earnings Ratio?
- How Is the P/E Ratio Calculated?
- P/E Ratio Formula and Example
- What Does a P/E Ratio of 10, 20, or 30 Mean?
- How Do You Calculate Earnings per Share?
- Trailing vs. Forward P/E: Which Should You Use?
- What Can Make a P/E Ratio High or Low?
- How Does Growth Affect the P/E Ratio?
- What Is the Price to Earnings Ratio of a Company That Keeps Borrowing?
- Can a P/E Ratio Be Negative?
- What Are the Limitations of the P/E Ratio?
- How to Use a P/E Ratio in Investment Analysis
- P/E Ratio Comparison Example
- Frequently Asked Questions
- What is a good P/E ratio?
- Is a lower P/E ratio always better?
- Which P/E ratio is best for comparing companies?
- Why is a company’s P/E ratio negative?
- Is a 20 P/E ratio good?
- Conclusion
Key Takeaways
- P/E ratio equals share price divided by earnings per share, and it is a way of pricing one dollar of profit.
- The earnings you divide by must match the period you are thinking about: last twelve months, this year’s estimate, or ten years of inflation-adjusted earnings.
- A trailing P/E of 20 and a forward P/E of 15 for the same company can both be correct at the same moment.
- There is no universal cheap or expensive threshold; sector norms, growth rates and interest rates all move the fair range.
- A low multiple is sometimes a warning rather than a bargain, and for cyclical businesses the earnings in the denominator are often near a peak.
What Is a Price to Earnings Ratio?
The price-to-earnings ratio, usually written P/E or PE, measures a company’s share price relative to its earnings per share. The result is a multiple, so a P/E of 18 means the market is paying eighteen dollars for every dollar of profit that share currently produces.
Investors use it as an equity valuation measure because it normalises price against profitability. Two companies with very different share counts, market capitalisations and revenue levels can sit side by side on the same basis, which is why screeners default to it.
It is also the most abused number in the category. The ratio tells you the relationship between price and reported earnings at one moment, and it says nothing on its own about cash flow, debt, growth or how those earnings were produced.
How Is the P/E Ratio Calculated?
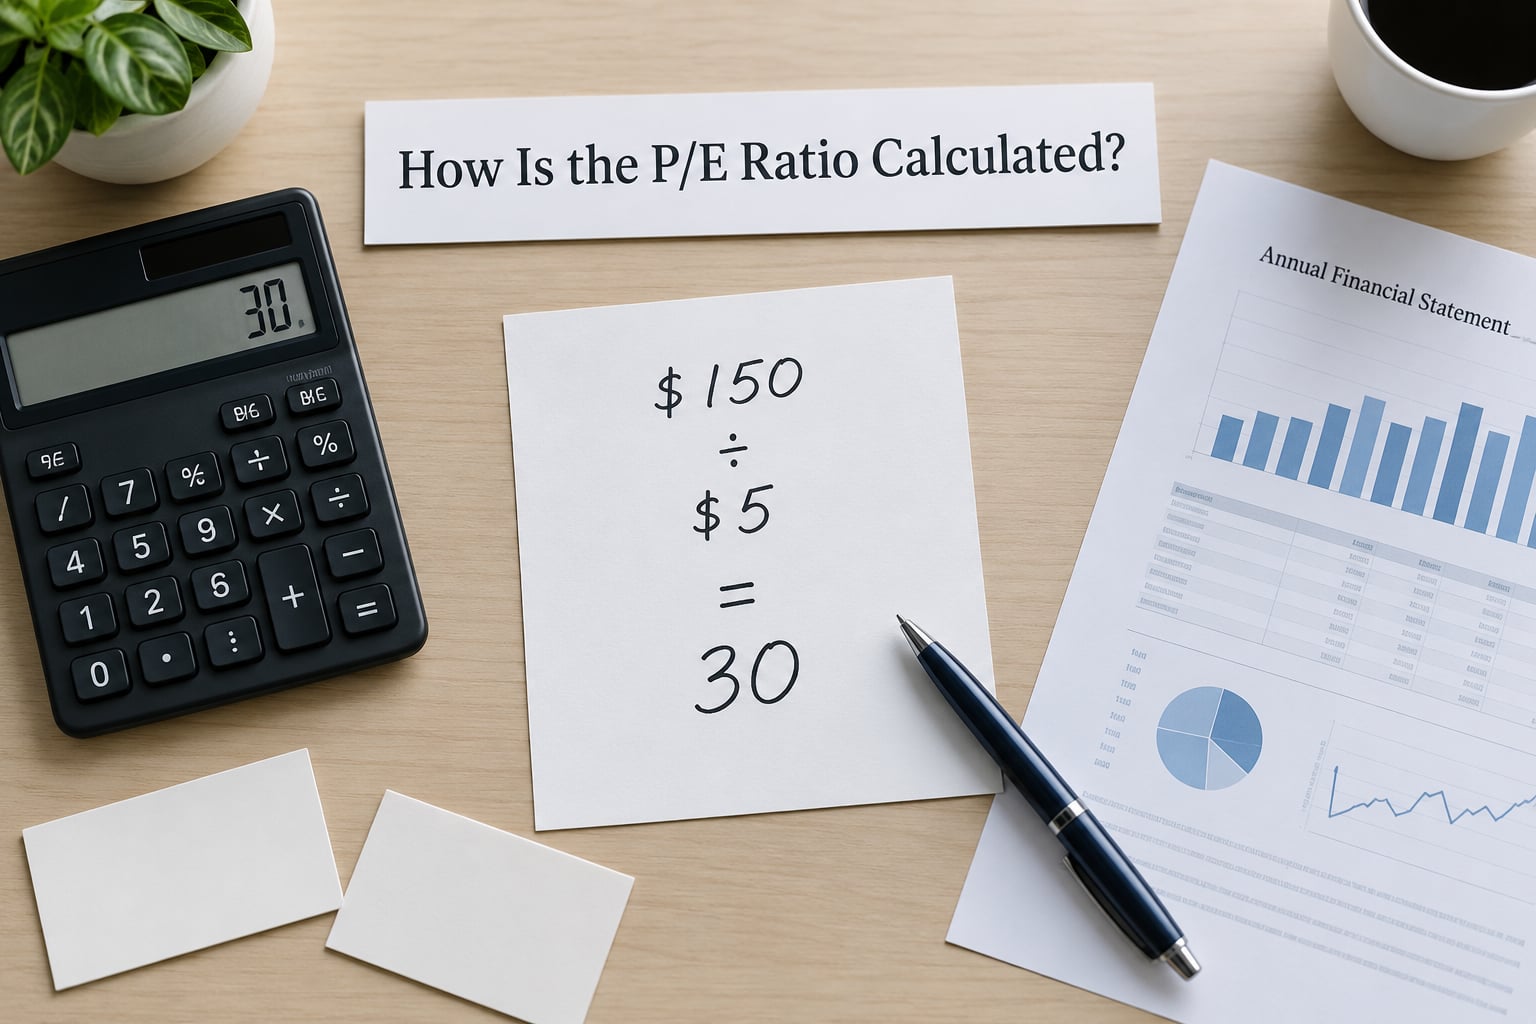
The calculation has three inputs and one division. Here is the layout:
| Input | What it is | Where it comes from |
|---|---|---|
| Share price | The current market price of one share | Any quote screen or the top of an income statement column |
| Net income | Profit after tax for the chosen period | Income statement, bottom line |
| Preferred dividends | Payments to preferred shareholders | Income statement, above net income to common |
| Ordinary shares outstanding | Weighted average shares over the same period | Income statement, below the earnings line |
| Earnings per share | Net income minus preferred dividends, divided by ordinary shares | Calculated or printed directly on the statement |
Dividing the two ends gives you the multiple: a share price of one hundred dollars against earnings per share of five dollars produces a P/E ratio of twenty. To know what is price to earnings ratio in practice, run that division for any company you are screening and you have the ratio in under a minute.
One rule prevents most beginner errors: never mix periods. A share price taken this morning divided by last year’s full-year EPS is a valid trailing ratio only if you accept that the price has already moved. Pair it with a same-day forward estimate and you get a different, equally valid number, and that is not an error, it is a different question.
P/E Ratio Formula and Example
Three steps, and the third one is the whole ratio.
Step one: gather the share price. Take the current market price of a single share, not the market capitalisation, not the enterprise value. If the shares trade at one hundred and forty dollars, write one hundred and forty.
Step two: select the earnings per share figure. Decide first whether you want trailing earnings, which are reported and settled, or forward earnings, which are analyst estimates for the coming year. Then take EPS from the income statement for that exact period.
Step three: divide. One hundred and forty divided by seven equals twenty, so that stock trades at a P/E of twenty.
| Measure | Company A | Company B |
|---|---|---|
| Share price | 140 dollars | 90 dollars |
| Trailing twelve-month EPS | 7.00 dollars | 4.50 dollars |
| Trailing P/E | 20 | 20 |
| Forward EPS estimate | 9.33 dollars | 5.60 dollars |
| Forward P/E | 15 | 16 |
Both companies look identical on trailing earnings and almost identical on forward earnings, even though one analyst group expects 33 percent earnings growth for A and 24 percent for B. Same headline multiple, different underlying assumptions, which is why experienced investors state the period out loud every single time.
What Does a P/E Ratio of 10, 20, or 30 Mean?
A multiple of ten means the market pays ten dollars for each dollar of annual profit per share. Twenty means twenty dollars, thirty means thirty dollars, and the same reading applies whether the earnings are trailing or estimated.
| P/E ratio | Plain reading | What usually supports it | What usually warns you |
|---|---|---|---|
| Under 10 | Ten dollars or less per dollar of profit | Mature business, weak growth, heavy cyclicality, net cash, or a market pricing decline | Falling earnings, thin margins, covenant pressure, a value trap |
| 10 to 15 | Value territory | Steady cash generation, dividend coverage, slow but dependable growth | Flat or declining revenue, industry disruption |
| 15 to 20 | Broadly the middle of the range | Moderate growth, stable margins, reasonable balance sheet | Little else, it is simply the crowd’s default assumption |
| 20 to 30 | Growth expectations priced in | Durable reinvestment, expanding margins, a credible runway | Estimates that quietly slipped for two or three quarters |
| Over 30 | Thirty-plus dollars per dollar of profit | Very strong growth, high reinvestment rates, a large addressable market | Almost any disappointment, because the multiple compresses hard |
None of those thresholds is a rule. A software firm at 35 and a bank at 11 can both be priced correctly, and comparing them directly tells you about their business models rather than about their bargains.
How Do You Calculate Earnings per Share?
Earnings per share, or EPS, is the profit attributable to one ordinary share over a stated period. The standard formula is net income minus preferred dividends, divided by the weighted average number of ordinary shares outstanding during that period.
Worked through with round numbers: a company earns forty million dollars in net income, pays two million dollars of preferred dividends, leaving thirty-eight million dollars for ordinary shareholders. With one million ordinary shares outstanding, EPS is thirty-eight dollars per share. At a share price of one hundred and fourteen dollars, the P/E ratio is three.
| Line | Figure |
|---|---|
| Net income | 40,000,000 |
| Less preferred dividends | 2,000,000 |
| Earnings to ordinary shareholders | 38,000,000 |
| Weighted average ordinary shares | 1,000,000 |
| Basic EPS | 38.00 |
Basic EPS uses the ordinary share count. Diluted EPS adds back the potential shares from options, convertibles and warrants, and it is usually the lower of the two, which is why data providers lean on it.
Then there is adjusted EPS, which strips out one-time gains and charges, restructuring costs and stock-based compensation. Analysts and companies both use it, and it can differ from reported EPS by a wide margin. Comparing a company against its peers means checking which version each side used, because mixing reported EPS with adjusted EPS quietly invents growth that never happened.
Trailing vs. Forward P/E: Which Should You Use?
Trailing uses earnings already reported. Forward uses analyst estimates for the next twelve months, and CAPE smooths a decade of inflation-adjusted profits into a single denominator.
| Ratio | Earnings it uses | Depends on estimates? | Best used for |
|---|---|---|---|
| Trailing P/E | Last twelve months, as reported | No | Comparing against history and peers on a clean, audited basis |
| Forward P/E | Next twelve months, analyst consensus | Yes | Judging whether today’s price is consistent with expected growth |
| CAPE ratio | Ten years of inflation-adjusted earnings, smoothed | No, but sensitive to the smoothing method | Long-cycle questions about index-level valuation |
Forward P/E is normally the lower of the two during a growth phase, because the denominator is expected to grow. When a company is shrinking, forward P/E sits above trailing, which is a quiet flag that the analyst consensus assumes better times are coming.
The weakness of forward P/E is that it inherits every error in the estimate. In cyclical industries the consensus is usually most confident at the exact moment the cycle turns, because recent results look excellent and everyone extrapolates them forward. On forum threads about valuation, experienced posters make the same warning about forecast earnings in commodity and energy names.
What Can Make a P/E Ratio High or Low?
The multiple is the output of two moving parts. Price responds to what investors expect; the denominator reflects what the business has already produced. Anything that shifts either side moves the ratio.
How Does Growth Affect the P/E Ratio?
Expected growth is usually the strongest single justification for a high multiple. If a company can lift earnings per share from two dollars to five dollars over three years, the same share price buys a much smaller share of future profit, so today’s multiple looks expensive and tomorrow’s looks sensible. That is why growth companies trade at 30 and mature companies at 12, and it is why a high multiple is not by itself a warning sign when growth is real and funded.
What Is the Price to Earnings Ratio of a Company That Keeps Borrowing?
Leverage inflates the multiple without any change in sentiment. Interest and repayments shrink net income and therefore EPS while the share price stays put, so the P/E climbs mechanically. Traders on market forums make the same point from the other direction: a ratio can drift upward on balance sheet decisions alone, with no change in how investors view the business. Compare net income to operating cash flow before drawing conclusions from a rising multiple.
Other drivers worth naming:
- Margins. Two companies with identical revenue can show very different multiples when one converts 8 percent of sales to profit and the other converts 25 percent.
- Interest rates. Higher discount rates push future profits further away, so multiples across the whole market compress; when rates fall, the reverse tends to happen.
- Financial risk. Debt service obligations, covenant headroom and dilution history all justify a discount.
- Cyclicality. Peak commodity or shipping earnings make the denominator look enormous and the ratio look tiny, right before earnings roll over.
- One-time items. Asset sales, litigation settlements and impairments can move reported EPS sharply in a single quarter.
Can a P/E Ratio Be Negative?
Yes, and when it happens the number carries no valuation information at all. A negative EPS produces a negative P/E, and a company with EPS near zero produces a P/E that swings wildly on rounding. Either way the ratio cannot be compared with anything.
Alternatives exist and each fixes a different gap:
- Price-to-sales compares market capitalisation with revenue. It ignores profitability, so two companies with the same sales and very different margins look identical.
- Price-to-book compares price with net assets. Useful for banks, insurers and asset-heavy firms; close to meaningless for companies whose main asset is people.
- EV/revenue and EV/EBITDA neutralise the capital structure, which matters when debt levels differ sharply between peers.
- Cash-burn analysis tracks quarterly cash consumption against cash on hand, giving months of runway and a dilution timeline.
No single replacement carries you all the way. Most professionals read two or three of these together for pre-profit companies and revisit the P/E once earnings turn positive.
What Are the Limitations of the P/E Ratio?
Accounting choices move the denominator. Depreciation schedules, capitalisation policies, provisions and stock-based compensation are all judgement calls, and two companies with identical economics can report meaningfully different earnings.
The ratio is also a moving target on the numerator. A ten percent share price drop halves nothing and changes the ratio by ten percent, which is why a P/E quoted without an as-of date is close to meaningless. Readers on investing forums ask constantly for dated figures because undated examples rot.
Cross-sector comparability is weak. Comparing a regulated utility with a software developer tells you about their capital intensity and growth curves, not about their price.
Cyclicality is the trap that catches experienced readers. A producer earning peak prices shows a low P/E precisely when the share is about to fall, and the reverse happens at the bottom. Value investors on r/Valuation put it plainly: a multiple of ten may look cheap, but a company’s value depends on far more than its current earnings.
Two structural effects also deserve a mention. Passive and index flows have pushed index-level multiples higher over time, which some readers read as permanent repricing and others as froth. And market watchers note that low index-level P/E readings have not reliably marked bottoms in over a century of data, which is why the ratio is treated as a sentiment gauge rather than a timing tool.
How to Use a P/E Ratio in Investment Analysis
Five checks, in this order, before you act on any number you find:
- Trace the inputs. Check the source and the period of the EPS first, on every single name. Is it reported or adjusted? Is it diluted? Is the price from today or from six months ago? If you cannot answer those questions, the ratio tells you nothing. Knowing what is price to earnings ratio in practice means being able to trace both inputs back to the income statement before you compare anything.
- Compare with the company’s own history. A stock that traded between 12 and 16 for five years and now sits at 28 has changed, and the question worth asking is what changed in the business.
- Compare with the right peers. Same subsector, similar capital intensity, comparable growth. Comparing a supermarket chain with a semiconductor designer produces a number with no interpretation.
- Write down the gap. Investigate why the multiple differs, in one sentence: “28 against a 14 peer average because the peer lost its largest customer.” If you cannot complete that sentence, you do not yet have an explanation.
- Test the assumptions behind the difference. Check whether consensus estimates have been rising or quietly falling for two or three quarters, and read the balance sheet for covenant pressure.
Treat the result as one input, never a trigger. A low or high multiple on its own is not an automatic buy or sell instruction, and any tool that promises otherwise is selling something.
P/E Ratio Comparison Example
Three fictional companies in the same industry, same share count scale, different stories. The table shows how a mechanical screen produces a shortlist that still needs explaining.
| Company | Share price | Trailing EPS | Trailing P/E | Expected EPS growth | Net debt to EBITDA |
|---|---|---|---|---|---|
| Meridian Components | 60 dollars | 6.00 | 10 | 2 percent | 1.8x |
| Carrow Industrial Systems | 95 dollars | 4.75 | 20 | 12 percent | 1.1x |
| Halden Automation | 140 dollars | 3.50 | 40 | 28 percent | Net cash |
Meridian screens as the cheapest at 10, but earnings are flat, leverage is the highest of the three and its largest customer has not renewed. On trailing numbers it looks like the bargain and the deeper look suggests the value trap the forum regulars warn about.
Halden screens as the expensive one at 40, and on a single-year view that multiple demands almost everything to go right. It also carries net cash, meaning no interest drag on future earnings, and its growth rate is the fastest in the group.
Carrow is the least dramatic of the three: a middle multiple, solid growth, moderate leverage, and the smallest gap between what the market pays and what the business earns. Whether it wins depends entirely on what you believe about the next two years, which is the point. The highest multiple is not automatically the best investment, and the lowest is not automatically the safest.
Frequently Asked Questions
What is a good P/E ratio?
There is no single good figure, because a multiple only means something next to a sector, a period and a growth assumption. Broadly, 15 to 20 fits mature businesses, 20 to 30 fits companies with dependable growth, and anything above 30 needs a credible expansion story. The most useful comparison is the company’s own five-year range against a handful of genuine peers in the same subsector.
Is a lower P/E ratio always better?
No. A low multiple can reflect weak prospects rather than a bargain, and for cyclical businesses the earnings in the denominator may be near a cycle peak, which makes the ratio look artificially cheap. Before treating a low P/E as value, check whether revenue is shrinking, whether estimates are falling, and whether cash flow supports the reported earnings.
Which P/E ratio is best for comparing companies?
Trailing P/E is the cleanest basis for comparison because it uses reported earnings rather than forecasts, so start there. Add forward P/E when growth expectations differ sharply between the companies, since it shows how much future growth each price already assumes. Mixing a trailing figure on one company with a forward figure on its peer tells you nothing reliable about what is price to earnings ratio.
Why is a company’s P/E ratio negative?
A P/E ratio turns negative when earnings per share is negative, which happens when a company reports a net loss for the period you are using. The negative figure carries no valuation information, because there are no earnings to divide by. For loss-making companies, price-to-sales, price-to-book, enterprise value to revenue and cash-burn analysis are the usual substitutes.
Is a 20 P/E ratio good?
A multiple of 20 sits near the middle of the range for a broad index and for many mature sectors, so it is a reasonable starting point rather than a verdict. It suits a business with steady profitability and moderate growth. It becomes demanding for a shrinking company and reasonable for a fast grower, which is why sector and history context decides the question.
Conclusion
The price-to-earnings ratio shows how many dollars investors pay for each dollar of a company’s earnings, which makes it the fastest way to compare two businesses of very different size. It also rewards context rather than a magic number.
Three things to do first with any ratio you find. Verify which earnings period and which share count produced it, so you know whether you are reading a trailing, forward or adjusted figure. Compare that multiple against the company’s own five-year range and two or three real peers in the same subsector.
Then ask what explains the gap. If the difference is supported by durable growth, defensible margins and a sound balance sheet, the higher multiple may be justified. If it rests on a cycle peak, borrowed accounting or falling estimates, the cheaper-looking stock is the riskier one. This is general educational information about a financial ratio, not personalised investment advice.