To learn how to read a balance sheet as an investor, treat it as a snapshot of what a company owns, what it owes and who funded it, then check those figures against cash flow over several years. Most readers can work through a full review in 30 to 60 minutes for a mid-sized private company, and the hard part is judgment rather than arithmetic. This guide walks the same ten steps in the same order every time, with a worked example so you can see what each step is meant to reveal.
One thing to fix before you start: a balance sheet is a photograph, not a story. It shows one date and says nothing about how the company got there. The notes and the cash flow statement carry the story, which is why the last steps in this process spend as much time on those as on the headline totals.
Table of Contents
- What You Need
- Step-by-Step: How to Read a Balance Sheet as an Investor
- How to Read a Balance Sheet as an Investor: Start With Business Context
- Check the Balance Sheet Equation
- Assess Liquidity and Near-Term Solvency
- Evaluate Asset Quality
- Analyze Debt and Solvency
- Read Equity as a Funding Source, Not a Moat
- Reconcile the Balance Sheet With Cash Flow
- Calculate Ratios and Compare Trends
- Test the Balance Sheet for Warning Signs
- How to Turn the Statements Into an Investment View
- Common Mistakes
- Frequently Asked Questions
- What is the easiest way to read a balance sheet?
- What should I look for first when reading a company balance sheet?
- Is a high current ratio always good for investors?
- How do I know whether a company has too much debt?
- Why is positive book value not enough to prove a company is strong?
- Conclusion: Start With Three Questions
What You Need
Gather these before you read a single line of numbers, because almost every bad analysis starts with a figure pulled from the wrong period or the wrong entity.
- The latest audited financial statements, usually the annual report filed with the regulator plus its full set of notes.
- The interim statements for the periods in between, at least the last two or three quarters.
- The prior-year balance sheet for comparison, plus the year before that if the notes flag a restatement.
- The cash flow statement and income statement that sit alongside the balance sheet. They are useless alone.
- Management discussion and analysis, which usually explains acquisitions, disposals and accounting changes in plain language.
- A spreadsheet and, optionally, accounting software so you can copy the figures once and then work without retyping them.
Three checks keep you out of trouble. First, confirm the figures are consolidated group accounts, not parent-company-only numbers, because holding companies often publish both and the two tell very different stories. Second, confirm every period is stated in the same currency and on the same accounting basis, since a change in measurement can move totals without any real change in the business. Third, note the reporting date and the audit opinion before you start.
Accounting policy is not housekeeping. Depreciation schedules, inventory costing, revenue recognition and the treatment of leases all change what the numbers mean, and two companies with identical economics can report very different balance sheets under different policies. Read the policy notes first, then decide how much of a gap you are willing to explain away.
Step-by-Step: How to Read a Balance Sheet as an Investor
How to Read a Balance Sheet as an Investor: Start With Business Context
Before any arithmetic, establish what the company actually does and how its cash cycle works. A manufacturer with 90-day inventory and 30-day receivables has a completely different balance sheet shape from a distributor holding 200 days of stock, even when the total assets are identical. Your reading of every later step depends on that context.
Four questions frame it: which industry is the company in, how long is the operating cycle from purchase to cash collection, which subsidiaries and acquisitions sit inside the group accounts, and when did the reporting period end. Add one more: which accounting policies could materially distort this statement compared with its peers.
Warning sign: if you cannot answer those four questions from the report and its notes, any ratio you calculate will be arithmetic without context.
Check the Balance Sheet Equation
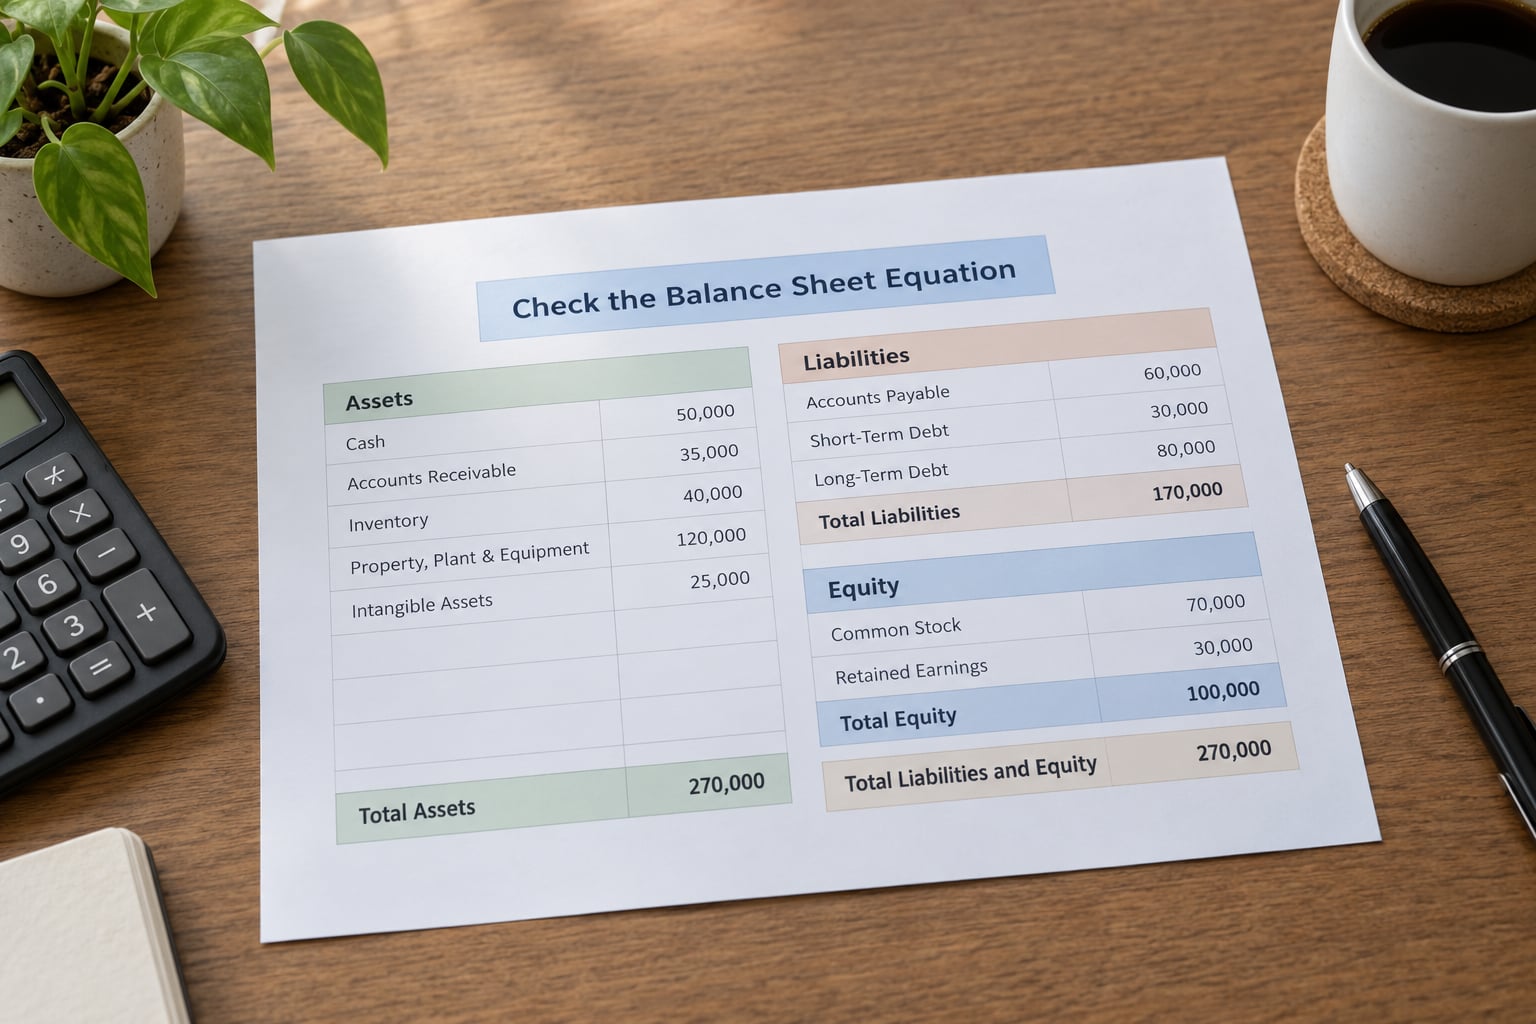
Every balance sheet obeys one identity: total assets equal total liabilities plus total equity. Walk down the assets side, splitting current items from non-current ones, then walk down the other side separating liabilities from equity.
Use this simplified example, a mid-sized industrial parts distributor, all figures in millions of the reporting currency.
| Assets | Amount | Liabilities and equity | Amount |
|---|---|---|---|
| Cash and equivalents | 120 | Accounts payable | 300 |
| Short-term investments | 30 | Accrued liabilities | 110 |
| Accounts receivable | 340 | Current portion of long-term debt | 130 |
| Inventory | 480 | Current lease liabilities | 25 |
| Prepaid and other current | 40 | Long-term debt | 640 |
| Property and equipment, net | 640 | Non-current lease liabilities | 130 |
| Goodwill and intangibles | 260 | Deferred taxes and other | 65 |
| Other long-term assets | 90 | Issued capital and reserves | 260 |
| Retained earnings | 400 | ||
| Treasury shares | -60 | ||
| Total assets | 2,000 | Total liabilities and equity | 2,000 |
The current assets total 1,010 and the non-current assets total 990. On the other side, current liabilities total 565 and non-current liabilities 835, giving total liabilities of 1,400 against equity of 600.
Result to look for: if the two sides do not agree, something has been missed, often an off-balance-sheet commitment or a misclassified item. Take it back to the statement before moving on.
Assess Liquidity and Near-Term Solvency
Liquidity tells you whether the company can settle obligations due within a year. The headline measure is the current ratio, which here is 1,010 divided by 565, or 1.79. That looks comfortable until you look at what sits inside those figures.
The quick ratio strips out inventory and prepaid items, the two least reliable current assets, and leaves 490 against 565, or 0.87. Working capital of 445 tells you the dollar cushion is positive, but the cushion is sitting in inventory and receivables, not in cash.
Then check the timing. Short-term obligations include the 130 of long-term debt coming due this year, and obligations that are not formally classified as debt still compete for cash: leases, supplier terms that shorten, tax payments and deferred consideration on acquisitions. Ask three questions of each liquidity ratio you compute: what is inside it, how much of it converts to cash within the cycle, and whether the company can refinance the short-dated portion if it needs to.
Warning sign: a strong current ratio built on inventory that is not turning, or receivables that are stretching past normal terms, is a measurement problem rather than a strength.
Evaluate Asset Quality
Not all assets are equal, and the ones that generate cash carry more weight than the ones sitting still. Split the asset side into productive assets that support revenue, productive assets that sit idle, and questionable balances whose value depends on an assumption.
Receivables deserve a question about ageing and concentration: how much sits with the five largest customers, and how much is past normal terms. Inventory needs an ageing profile and a look at the reserve policy, because a reserve that moves with the write-down cycle tells you management’s real view. Goodwill and intangibles tell you what was bought rather than what was built, and internally developed software expensed as incurred produces a very different balance sheet from a company that capitalized the same spending.
Property carrying values only move when revalued, sold or depreciated down, so a large book value can be years out of date. Useful questions: has the company sold assets recently and at what gain or loss, has anything been written down or revalued repeatedly, and does the impairment testing reference cash flows that assume growth the current numbers do not support.
Result to look for: a picture of which assets would convert to cash quickly and at close to carrying value if the business were sold tomorrow.
Analyze Debt and Solvency
Not every liability is debt, and mixing the two is the most common analytical error in this step. Accounts payable and accrued liabilities are operating items that grow with the business and are usually repaid from operations. Interest-bearing borrowings, lease liabilities and pension or deferred consideration obligations are financing items, and they are what you test against cash generation.
Check whether borrowings are secured, which usually means assets have already been pledged as collateral, and what the maturity schedule looks like. A company with 770 of debt spread over seven years is in a different position from one with the same total due within two, no matter what the borrowing ratio says. Read the covenant notes: debt-to-earnings tests, interest cover floors, change-of-control clauses and restrictions on new borrowing.
Use several measures rather than one. Debt-to-equity here is 770 against 600, or 1.28. Net debt, deducting the 150 of cash and short-term investments, is 620. Against annual EBITDA of 210, gross debt-to-EBITDA is roughly 3.7. Interest expense of 58 gives an interest cover of about 3.6 times.
Each measure has limits. Debt-to-equity falls when equity shrinks, net debt ignores restricted cash, EBITDA excludes real cash costs, and interest cover assumes last year’s profit repeats. Leases and purchase commitments may sit off the reported balance sheet, so the note disclosures matter as much as the totals.
Warning sign: debt rising faster than the ability to service it.
Read Equity as a Funding Source, Not a Moat
Book equity is simply what remains after liabilities are subtracted, which makes it a record of funding history rather than proof of business quality. In the example, the 600 of equity is 260 of issued capital and reserves, 400 of retained earnings and a 60 deduction for shares held in the company treasury.
Retained earnings are the interesting number because they are cumulative profits retained rather than distributed, and they only stay healthy if the underlying assets still produce returns. A large retained earnings balance sitting against heavy goodwill and weak cash flow is not the strength it appears to be.
Watch the direction of travel. Sustained dividends and buybacks reduce equity, and so do years of losses, while currency translation, revaluation and pension adjustments can move it without any cash effect at all. Thin capitalization, where equity is a small share of total funding, leaves a business exposed to a single bad year, and that exposure is the risk a shareholder actually carries.
Result to look for: whether equity is growing from retained profits or shrinking because cash is leaving the business.
Reconcile the Balance Sheet With Cash Flow
This is where reported profit is tested. If earnings rise while receivables grow faster than revenue, or inventory accumulates faster than sales, or an increasing share of spending is capitalized instead of expensed, the profit quality is weaker than the income statement suggests.
Pull operating cash flow and free cash flow from the cash flow statement and compare them with reported earnings over at least five years. In a healthy business, cumulative operating cash flow roughly tracks cumulative net profit, adjusted for genuine non-cash charges. Free cash flow, meaning operating cash flow less capital expenditure, is the figure that has to cover interest, tax, dividends and reinvestment.
In the worked example, operating cash flow of 160 against interest of 58 leaves 102 before capital expenditure. Spending 70 on maintenance and growth capital leaves 32 of free cash flow, which is thin but positive. Compare that with reported profit and ask why the gap exists.
Warning sign: a widening gap between profit and operating cash flow across several periods, explained by one-off items each time.
Calculate Ratios and Compare Trends
Ratios compress a balance sheet into comparable figures, and they work best as a small set tracked over time against peers. For liquidity, current ratio, quick ratio and working capital. For borrowing burden, debt-to-equity, net debt, debt-to-EBITDA and interest cover. For asset efficiency, asset turnover and receivable and inventory days. For capital intensity, capital expenditure as a share of sales and total assets to equity.
In the example, asset turnover is 2,000 of assets against sales, so each unit of assets supports a small number of sales turns; receivable days of 340 divided by sales per day works out to a healthy figure, while 480 of inventory against the same cost base implies slow-moving lines. Compute them, then compute them again for the previous three years and for two or three direct competitors.
Rising return on assets or return on equity is not automatically progress. It can come from genuine margin improvement, or from more borrowed money relative to equity, or from selling a strong asset, or from a shrinking equity base after buybacks and losses. Always ask which of the four is driving it before you change your view.
Result to look for: improvement that holds across several periods and against peers, not a single good year.
Test the Balance Sheet for Warning Signs
One of these alone means less than several together.
- Negative or near-zero equity that persists for more than a couple of periods.
- Recurring losses drawing retained earnings down faster than new capital replaces them.
- Weak interest cover, with EBITDA barely covering interest or falling below it.
- Rising overdue debt appearing in the notes or the auditor’s emphasis of matter.
- Doubtful asset values, such as goodwill resting on optimistic forecasts or reserves that lag slow-moving inventory.
- Frequent covenant breaches or waivers, which signal the lenders have more information than the summary figures show.
- Late filings or modified audit opinions, including scope limitations and going-concern language.
Verify each one against the notes, the cash flow statement and the management discussion before drawing a conclusion. A waiver can be routine and administrative; so can a delay. What matters is whether the same issue keeps reappearing.
Warning sign: a qualified opinion or a going-concern paragraph, which overrides everything else on the page.
How to Turn the Statements Into an Investment View
Decisions come out of the analysis, not out of any single ratio. Balance sheet findings feed five questions: how much downside protection exists, whether the business can reinvest without new funding, how durable the earnings are, how much financial flexibility management retains, and what the findings imply for valuation.
A useful closing frame has four parts. Name the single strongest feature, in this example the positive and modest net debt position relative to cash generation. Name the largest balance sheet risk, here inventory and receivables making up most current assets. Name the metric that would invalidate the thesis, in this case interest cover falling below two times or the cash conversion gap widening for a second year. Then state what the combination implies for what you would pay.
That frame works beyond one company. A company with little debt, credible assets and steady cash conversion supports a different price than one whose value depends on goodwill, covenant waivers and a shrinking equity base. The statements tell you which of those you are holding.
Common Mistakes
These are the errors that show up most often, and each has a straightforward correction.
- Reading a single date. A balance sheet is one moment. Correct it by pulling at least three years of statements and reading the trend.
- Comparing incompatible policies. Different depreciation lives or capitalization habits can explain gaps that have nothing to do with performance. Check the policy notes before comparing anything.
- Treating all cash as available. Restricted, pledged or offshore cash is not free. The notes usually break it out.
- Confusing equity with liquidity. Large equity says nothing about cash in hand. Check cash and quick assets directly.
- Relying on one ratio. Every ratio has a blind spot. Use a small set and read them against the notes.
- Ignoring the footnotes. Commitments, contingencies, related-party balances and audit qualifications usually matter more than the totals.
- Confusing growth with cash generation. Expanding receivables and inventory look like growth in the balance sheet and can hide the opposite in the cash flow statement.
- Comparing companies without normalizing. Adjust for one-off asset sales, exceptional gains and changes in accounting policy before concluding anything from a side-by-side table.
- Reading debt without maturities or covenants. The maturity wall and the covenant terms determine when trouble arrives, not the headline total.
Practical habits that help: keep a one-page summary per company and update it each reporting date, work only from filed statements rather than summaries or presentations, write down the two or three questions each review raises, and revisit the same questions a year later to see whether management answered them.
Frequently Asked Questions
What is the easiest way to read a balance sheet?
Start with the accounting equation, then split assets and liabilities into current and non-current. Read the accounting policy notes before any ratio work, work from the cash flow statement alongside the balance sheet, and compare at least three years of figures. The easiest route is a fixed order every time, so nothing important gets skipped under time pressure.
What should I look for first when reading a company balance sheet?
Look first at cash and short-term investments against obligations due within a year, then at interest-bearing debt and its maturities. Those two comparisons tell you whether near-term pressure exists. Check the audit opinion and the notes on contingencies next, because qualifications and commitments can change the picture more than any line item above them.
Is a high current ratio always good for investors?
No. A high current ratio can be built from inventory that does not turn or receivables that are stretching past normal terms. Compare it with the quick ratio, look at the aging of receivables and the turnover of inventory, and check whether short-dated debt is being refinanced. Treatment and sector norms differ by country and company, so compare within the same industry.
How do I know whether a company has too much debt?
There is no single threshold. Compare interest-bearing debt with cash generation using debt-to-EBITDA and interest cover, then examine the maturity schedule, secured status and covenant terms. Two companies with the same total debt can be in very different positions. Accounting treatment, lease accounting and reporting rules vary by jurisdiction, which also changes what you see reported.
Why is positive book value not enough to prove a company is strong?
Book equity is the residual after liabilities, so it records funding history rather than business quality. It can rest on goodwill and intangible assets that may not convert to cash, or on retained earnings from years when conditions were different. Check whether equity is growing from real cash profits and whether the assets backing it produce returns above their cost.
Conclusion: Start With Three Questions
If you remember nothing else from this guide on how to read a balance sheet as an investor, remember three questions. Can the company meet its obligations due within a year? Do the reported assets have credible value if you had to convert them today? And is the debt load manageable relative to what the business actually generates in cash?
Answer those, then confirm the answers hold across several years, against the notes and against the cash flow statement. One date proves nothing, and a single ratio will mislead you sooner than it will help.
This material is educational and general. It is not personalized investment advice, and accounting treatment, reporting rules and market conditions vary by country, sector and company. Consider a qualified financial adviser before acting on anything you read here.